Survey of Users with Low Vision Results
Introduction
In March 2013, WebAIM conducted a survey of users with low vision. We received 216 valid responses to this survey. This was the first survey WebAIM has conducted of this population, but we hope to conduct additional surveys of this nature again in the future. If you have recommendations or questions you would like us to ask, please contact us.
A few disclaimers and notices:
- Totals may not equal 100% due to rounding.
- Total responses (n) for each question may not equal 216 due to respondents not answering that particular question.
- The sample was not controlled and may not represent all users with low vision.
Demographics
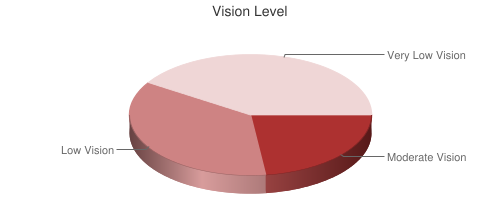
Vision Level
| Response | # of Respondents | % of Respondents |
|---|---|---|
| Moderate Vision | 50 | 23% |
| Low Vision | 77 | 36% |
| Very Low Vision | 89 | 41% |
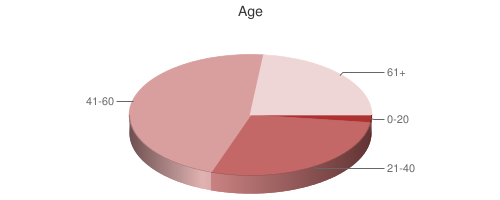
Age
| Response | # of Respondents | % of Respondents |
|---|---|---|
| 0-20 | 5 | 2% |
| 21-40 | 60 | 28% |
| 41-60 | 98 | 46% |
| 61+ | 50 | 23% |
| Response | # of Respondents | % of Respondents |
|---|---|---|
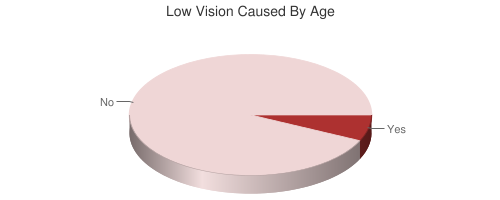
| Yes | 14 | 7% |
| No | 199 | 93% |
Even though the majority of respondents were over age 41, these respondents did not have a higher likelihood of having Low or Very Low Vision.
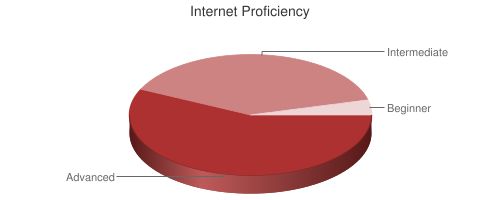
Internet Proficiency
| Response | # of Respondents | % of Respondents |
|---|---|---|
| Advanced | 123 | 57% |
| Intermediate | 84 | 39% |
| Beginner | 8 | 4% |
Respondents indicate a very high level of internet proficiency.
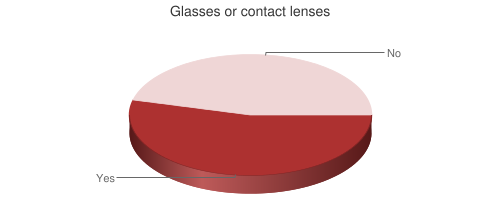
Vision Correction
| Response | # of Respondents | % of Respondents |
|---|---|---|
| Yes | 115 | 54% |
| No | 97 | 46% |
The National Eye Institute and the Vision Council of America both state that 75% of adults wear glasses or contact lenses, so these numbers are notably lower than the overall population.
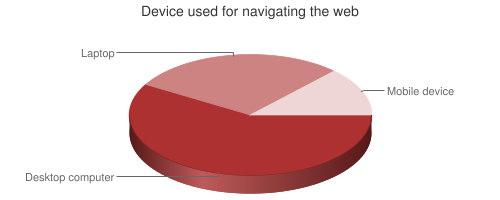
Primary Device Used
| Device | # of Respondents | % of Respondents |
|---|---|---|
| Desktop computer | 126 | 59% |
| Laptop | 61 | 29% |
| Mobile device | 28 | 13% |
Younger respondents were much more likely to use a mobile device and much less likely to use a desktop computer. Those aged 40 or younger were twice as likely to use a mobile device for navigating the web than those over 40.
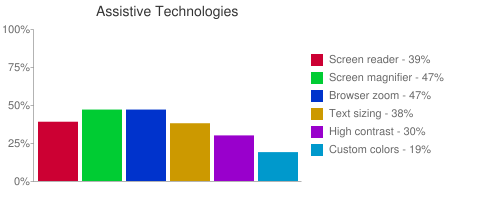
Assistive Technologies
| Assistive Technology | # of Respondents | % of Respondents |
|---|---|---|
| Screen reader | 84 | 39% |
| Screen magnifier software | 102 | 47% |
| Browser zoom controls (zooms all page content) | 102 | 47% |
| Browser text sizing controls (increases only text sizes) | 82 | 38% |
| High contrast modes | 64 | 30% |
| Customized page colors or custom style sheets | 42 | 19% |
It's clear that a wide variety of technologies are used by those with low vision. 69% of respondents use multiple technologies (e.g., a screen reader and a screen magnifier), with 15% of respondents using 4 or more of these types of technologies. Both a screen reader and a screen magnifier were used by 23% of respondents.
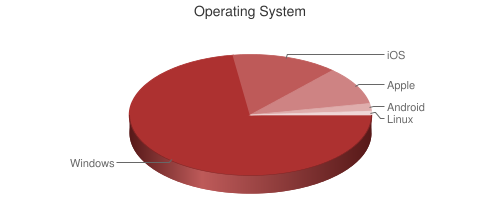
Operating System
| Response | # of Respondents | % of Respondents |
|---|---|---|
| Windows | 156 | 72.2% |
| iOS | 31 | 14.3% |
| Apple | 22 | 10.2% |
| Android | 5 | 2.3% |
| Linux | 2 | 0.9% |
Operating system data above was detected from the system used to complete the survey. It is of interest that iOS is the second most common operating system. Of the iOS devices, 21 (9.7%) were using iPads and 10 (4.6%) were using iPhones.
Primary Browser
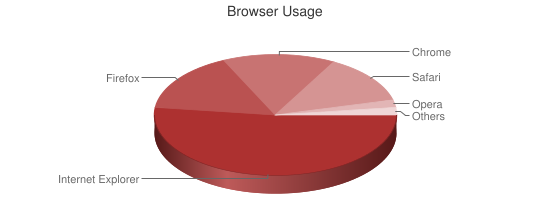
| Browser | # of Respondents | % of Respondents |
|---|---|---|
| Internet Explorer | 107 | 52.2% |
| Firefox | 33 | 16.1% |
| Chrome | 30 | 14.6% |
| Safari | 26 | 12.7% |
| Opera | 4 | 2.0% |
| Others | 5 | 2.4% |
Usage of Internet Explorer by respondents is at least twice as high as the overall population, perhaps suggesting poor support for assistive technologies or keyboard accessibility in other browsers. Screen reader users were 50% more likely to use Internet Explorer and 75% less likely to use Chrome than non-screen reader users. Respondents over age 40 were also more likely to use Internet Explorer.
For Internet Explorer users, about half of respondents used IE 9 or newer and half used IE 8 or older.
JavaScript Enabled
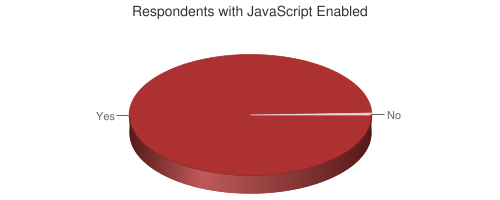
| JavaScript Enabled | # of Respondents | % of Respondents |
|---|---|---|
| Yes | 215 | 99.5% |
| No | 1 | 0.5% |
JavaScript support was detected when the survey was submitted. These results clearly indicate that it is important that scripted interfaces be made accessible to low vision users.
Primary Screen Reader
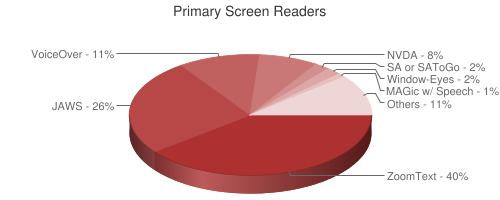
| Screen Reader | # of Respondents | % of Respondents |
|---|---|---|
| ZoomText | 45 | 40% |
| JAWS | 29 | 26% |
| VoiceOver | 12 | 11% |
| NVDA | 9 | 8% |
| System Access or System Access To Go | 2 | 2% |
| Window-Eyes | 2 | 2% |
| MAGic with Speech | 1 | 1% |
| ChromeVox | 0 | 0% |
| Other | 12 | 11% |
112 respondents indicated that they use a screen reader. As would be expected, ZoomText usage is much higher among users with low vision than among all users of screen readers. However, we note that some caution may be in order regarding this data as it's possible that some respondents may have selected ZoomText because they use the screen magnification functions of this software, but do not use the screen reader functions of this software.
Mobile Platforms
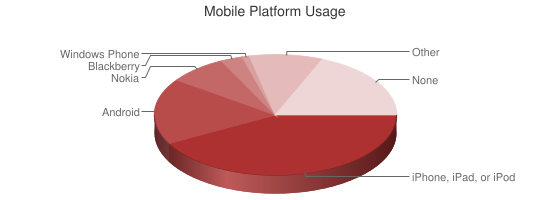
| Mobile Platform | # of Respondents | % of Respondents |
|---|---|---|
| Apple iPad, iPhone, or iPod touch | 93 | 43.1% |
| Android | 39 | 18.1% |
| Nokia | 17 | 7.9% |
| Blackberry | 6 | 2.8% |
| Windows Phone | 1 | 0.5% |
| Other | 18 | 9.6% |
| None or No Response | 42 | 19.4% |
As with screen reader users, Apple dominates in the mobile space for users with low vision. Those with very poor vision are more likely to use an iOS device than users with less severe vision loss, and they are four times more likely to use an iOS device than an Android phone.
Mobile Accessibility Settings
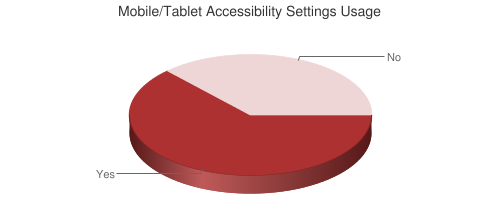
| Response | # of Respondents | % of Respondents |
|---|---|---|
| Yes | 134 | 63% |
| No | 78 | 37% |
Those who primarily use an iOS device are much more likely than users of other devices to use accessibility settings or software.
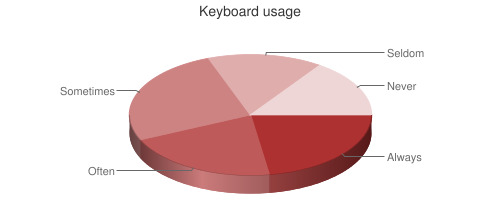
Keyboard Navigation
| Response | # of Respondents | % of Respondents |
|---|---|---|
| Always | 49 | 24.5% |
| Often | 46 | 23.0% |
| Sometimes | 59 | 29.0% |
| Seldom | 33 | 16.5% |
| Never | 14 | 17% |
Keyboard usage is very mixed among respondents. It is of note, however, that 47.5% of respondents always or often use a keyboard for web page navigation. Those with very poor vision are three times more likely to always use a keyboard than users with moderate vision. 66.6% of screen reader users reported always or often using a keyboard, but even 29.5% of those who don't use a screen reader use the keyboard always or often.
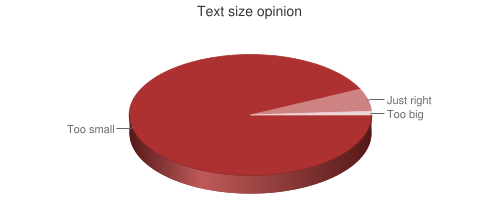
Text Sizes
| Response | # of Respondents | % of Respondents |
|---|---|---|
| Too small | 170 | 93% |
| Just right | 11 | 6% |
| Too big | 2 | 1% |
This shouldn't necessarily suggest that web sites need to increase their text size, but it clearly indicates that standard text sizes on the web are not adequate for the vast majority of users with low vision.
Text Resizing Widgets

| Response | # of Respondents | % of Respondents |
|---|---|---|
| Very useful | 46 | 27% |
| Somewhat useful | 76 | 45% |
| Not at all useful | 46 | 27% |
Opinions of in-page text resizing widgets are very mixed. Respondents who always or often use a keyboard found these widgets much less useful than non-keyboard users. Interestingly, those who use browser text sizing options were twice as likely to find in-page text resizing widgets very useful than those who do not use these browser settings. Those with beginning internet proficiency were much more likely to find them useful than those with advanced internet proficiency.
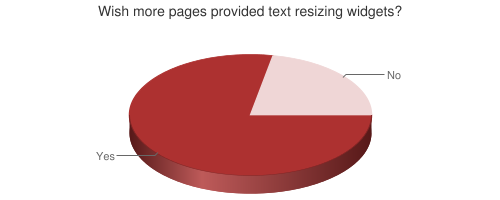
| Response | # of Respondents | % of Respondents |
|---|---|---|
| Yes | 125 | 78% |
| No | 35 | 22% |
The majority of respondents would like to see more in-page resizing widgets. Care should be taken, however, in considering the impact of such widgets on other users.
User Controls
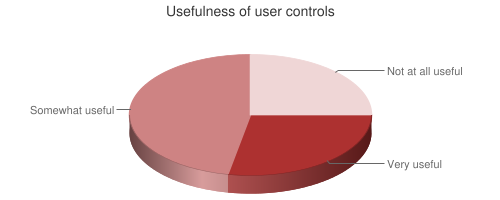
| Response | # of Respondents | % of Respondents |
|---|---|---|
| Very useful | 43 | 28% |
| Somewhat useful | 72 | 47% |
| Not at all useful | 39 | 25% |
Magnification Level
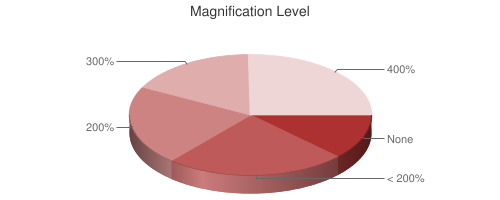
| Response | # of Respondents | % of Respondents |
|---|---|---|
| No magnification is used | 22 | 12% |
| Less than 2X or 200% | 44 | 24% |
| 2X or 200% | 39 | 21% |
| 3X or 300% | 31 | 17% |
| 4X or 400% or larger | 46 | 25% |
Color Contrast
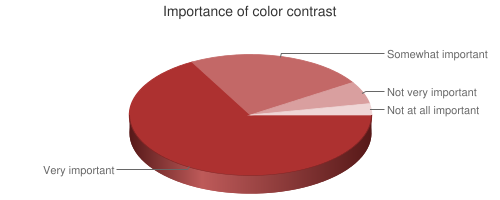
| Response | # of Respondents | % of Respondents |
|---|---|---|
| Very important | 126 | 67% |
| Somewhat important | 45 | 24% |
| Not very important | 12 | 6% |
| Not at all important | 5 | 3% |
It is clear from these responses that adequate contrast is important to users with low vision with 91% of respondents saying it is very or somewhat important.
Skip Links
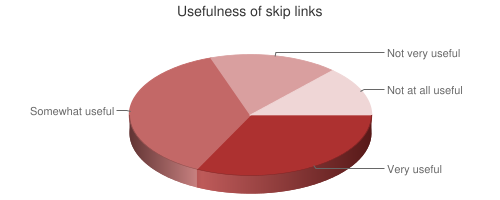
| Response | # of Respondents | % of Respondents |
|---|---|---|
| Very useful | 53 | 32% |
| Somewhat useful | 60 | 37% |
| Not very useful | 29 | 17% |
| Not at all useful | 22 | 13% |
Keyboard users are much more likely to find skip links useful. Respondents with beginner internet proficiency are more likely to find skip links useful than those with advanced proficiency, suggesting that more proficient users may navigate pages using other methods.
Web Accessibility Progress
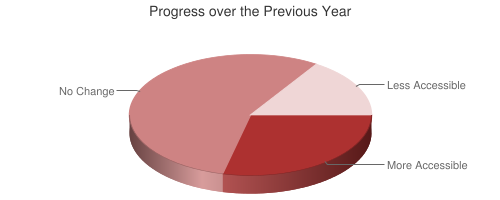
| Response | # of Respondents | % of Respondents |
|---|---|---|
| Web content has become more accessible | 57 | 28.6% |
| Web content accessibility has not changed | 111 | 55.8% |
| Web content has become less accessible | 31 | 15.6% |
Problematic Items
The survey asked respondents to select their most, second most, and third most problematic items from a list. In giving each selected item a weighting, the following chart shows the overall rating of difficulty and frustration for each item.
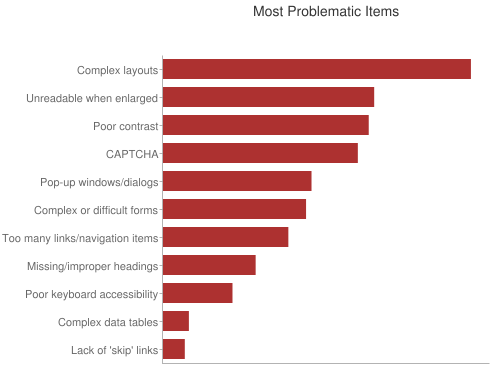
Problematic items identified are (in order, with most difficult/frustrating first):
- Complex page layouts
- Content that becomes unreadable when enlarged
- Poor contrast
- CAPTCHA - images presenting text used to verify that you are a human user
- Pop-up windows or dialog boxes
- Complex or difficult forms
- Too many links or navigation items
- Missing or improper headings
- Poor keyboard accessibility
- Complex data tables
- Lack of skip to main content links
Complex page layouts were by far identified as the most problematic item. While 69% of respondents found skip links very or somewhat useful, lack of skip links was the least problematic item identified. 47.5% of respondents always or often use a keyboard, yet they also found poor keyboard accessibility a low impact issue.
Conclusion
This data shows very diverse demographics and opinions among those with low vision. Respondents used a wide variety of assistive technologies, with most respondents using multiple technologies. For designers and developers, there is no single tool, technique, or approach to meeting the needs of this population. And great care should be taken in implementing solutions for this audience which may impact usability or accessibility for other site users.
Social Media Accessibility