Screen Reader User Survey #4 Results
Introduction
In May 2012, WebAIM conducted a survey of preferences of screen reader users. We received 1782 valid responses to this survey. This was a follow-up survey to the original WebAIM Screen Reader User Survey of January 2009 and the follow-up surveys from October 2009 and December 2010. Additional surveys were conducted in January 2014, July 2015, and October 2017.
A few disclaimers and notices:
- Totals may not equal 100% due to rounding.
- Total responses (n) for each question may not equal 1782 due to respondents not answering that particular question.
- The sample was not controlled and may not represent all screen reader users.
- We hope to conduct additional surveys of this nature again in the future. If you have recommendations or questions you would like us to ask, please contact us.
Demographics
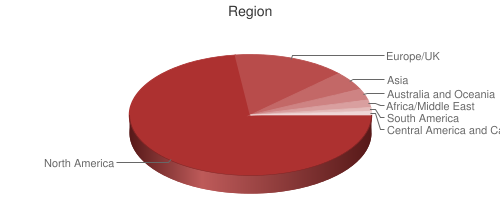
Region
| Response | # of Respondents | % of Respondents |
|---|---|---|
| North America | 1246 | 73.1% |
| Europe/UK | 262 | 15.4% |
| Asia | 82 | 4.8% |
| Australia and Oceania | 58 | 3.4% |
| Africa/Middle East | 29 | 1.7% |
| South America | 16 | 0.9% |
| Central America and Caribbean | 12 | 0.7% |
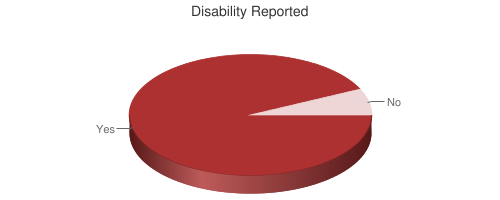
Disability Reported
| Response | # of Respondents | % of Respondents |
|---|---|---|
| Yes | 1610 | 93% |
| No | 126 | 7% |
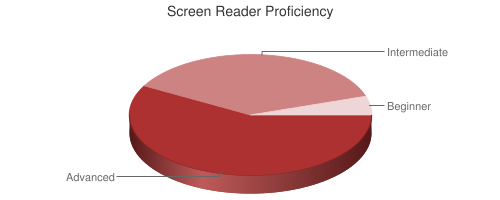
Screen Reader Proficiency
| Response | # of Respondents | % of Respondents |
|---|---|---|
| Advanced | 1014 | 58% |
| Intermediate | 651 | 37% |
| Beginner | 83 | 5% |
Screen reader proficiency of respondents has increased in each successive survey. Those who use screen readers due to a disability report themselves as being much more proficient with screen readers. Only 3% of those with disabilities considered their proficiency to be "Beginner" compared to 33% of those without disabilities.
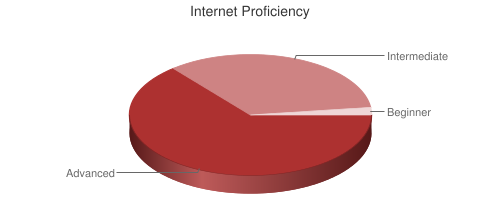
Internet Proficiency
| Response | # of Respondents | % of Respondents |
|---|---|---|
| Advanced | 1125 | 64.2% |
| Intermediate | 588 | 33.6% |
| Beginner | 38 | 2.2% |
Internet proficiency has generally remained the same across all surveys.
Devices Used
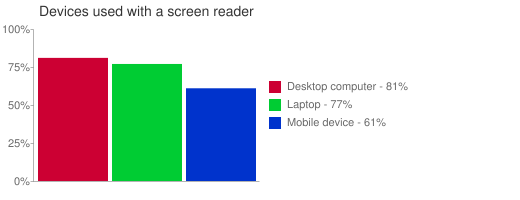
| Device | # of Respondents | % of Respondents |
|---|---|---|
| Desktop computer | 1402 | 80.8% |
| Laptop | 1344 | 77.4% |
| Mobile device | 1056 | 60.8% |
When considering respondents who indicated that they use multiple devices, 1058 respondents (59%) use both a desktop computer and a laptop. 739 respondents (41%) use a screen reader on all three devices. Only 10 respondents reported using a screen reader exclusively on a mobile device.
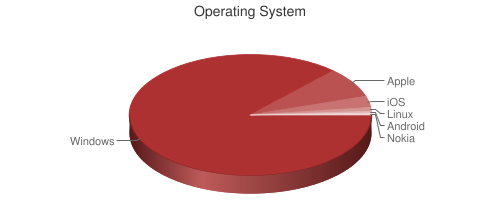
Operating System
| Response | # of Respondents | % of Respondents |
|---|---|---|
| Windows | 1547 | 87% |
| Apple | 151 | 8.5% |
| iOS | 59 | 3.4% |
| Linux | 13 | 0.7% |
| Android | 5 | 0.3% |
| Nokia | 3 | 0.2% |
Operating system data above was detected from the system used to complete the survey. Of the iOS devices, 46 were using iPhones, 12 were using iPads, and 1 was using an iPod.
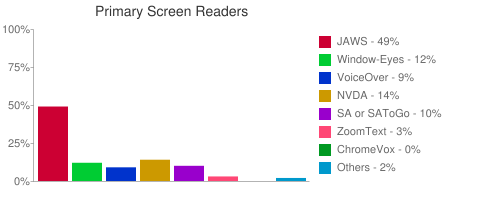
Primary Screen Reader
| Screen Reader | # of Respondents | % of Respondents |
|---|---|---|
| JAWS | 853 | 49.1% |
| Window-Eyes | 214 | 12.3% |
| VoiceOver | 159 | 9.2% |
| NVDA | 238 | 13.7% |
| System Access or System Access To Go | 181 | 10.4% |
| ZoomText | 49 | 2.8% |
| ChromeVox | 4 | 0.2% |
| Other | 38 | 2.2% |
While JAWS is still the most popular screen reader, it has seen a significant decline in primary usage - down to 49% from 66.4% in October 2009 and 59.2% in December 2010. Window-Eyes and ZoomText saw small increases in primary screen reader usage while VoiceOver saw a small decrease in usage. NVDA saw continued increase in usage, up to 13.7% from 2.9% in 2009 and 8.6% in 2010 (a nearly 500% increase in just 2.5 years). Perhaps most surprising is the significant increase in usage of System Access or System Access to Go, jumping to 10.4% from only 4.7% in December 2010.
It is clear that screen reader users are abandoning more expensive primary screen readers for free and low-cost alternatives.
There was no marked difference in primary screen reader use between respondents with and without disabilities, with JAWS being slightly more popular and NVDA being slightly less popular among users with disabilities. Those with a screen reader proficiency of "Beginner" were less likely to use JAWS and nearly twice as likely to use NVDA than those with "Advanced" screen reader proficiency.
Regional differences are also of note. JAWS was much more popular in Asia (68% of respondents), Australia (58%), and North America (50%) than in Europe/UK (37%). NVDA was nearly 4 times more popular in Europe/UK than in North America.
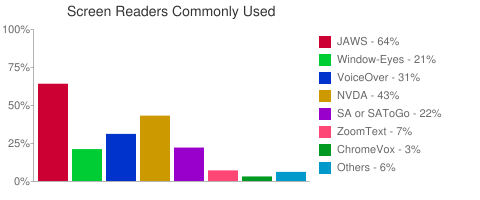
Screen Readers Commonly Used
| Screen Reader | # of Respondents | % of Respondents |
|---|---|---|
| JAWS | 1106 | 63.7% |
| Window-Eyes | 360 | 20.7% |
| VoiceOver | 547 | 30.7% |
| NVDA | 747 | 43.0% |
| System Access or System Access To Go | 384 | 22.1% |
| ZoomText | 118 | 6.8% |
| ChromeVox | 48 | 2.8% |
| Other | 103 | 5.9% |
JAWS usage on desktop/laptop continues to decrease while both NVDA and VoiceOver increase. Window-Eyes and System Access usage is generally unchanged.
The following chart shows changes in screen reader usage over time.
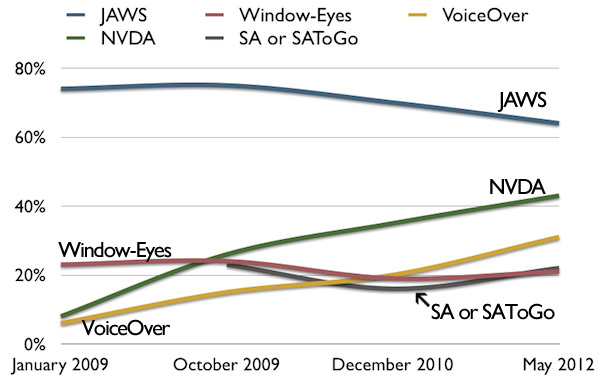
58% of respondents use more than one desktop/laptop screen reader. 26% use three or more, and 9% use four or more different screen readers. The percentages of respondents using multiple screen readers is notably increasing over time.
Screen Reader Updates
| Response | # of Respondents | % of Respondents |
|---|---|---|
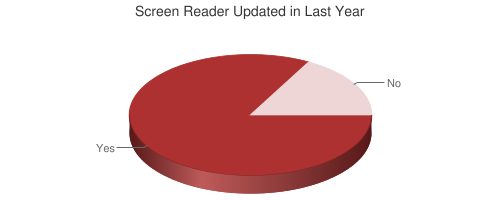
| Yes | 1428 | 82.7% |
| No | 299 | 17.3% |
The vast majority of respondents updated their primary screen reader within the previous year. The percentage of users updating in the previous year has increased slowly over the course of these surveys. It's important to note that many users may still be using screen readers that are several years old.
Users of NVDA (95.3% updated in the previous year) and Window-Eyes (92.6%) were more likely to have updated their screen reader in the previous year, whereas users of JAWS (80%), VoiceOver (78.3%), and especially ZoomText (51%) were less likely to have updated.
Reasons for Use
| Response | # of Respondents | % of Respondents |
|---|---|---|
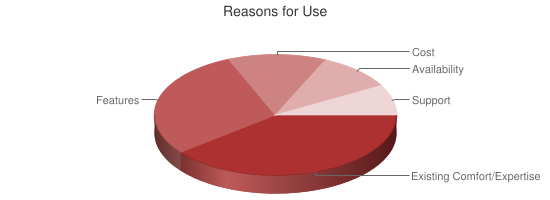
| Existing Comfort/Expertise | 674 | 39.2% |
| Features | 502 | 29.2% |
| Cost | 227 | 13.2% |
| Availability | 177 | 10.3% |
| Support | 141 | 8.2% |
When compared to October 2009, cost has notably increased as a main reason for using their primary screen reader. This may help explain the shift to less expensive screen readers. Only 1.7% of JAWS users cited Cost as the main reason for using it, compared to 48.3% of NVDA users and 30.3% of System Access users. Availability was cited as the primary reason by VoiceOver users. Existing Comfort/Expertise was cited as the primary reason by JAWS, Window-Eyes, and ZoomText users.
Braille Output
| Response | # of Respondents | % of Respondents |
|---|---|---|
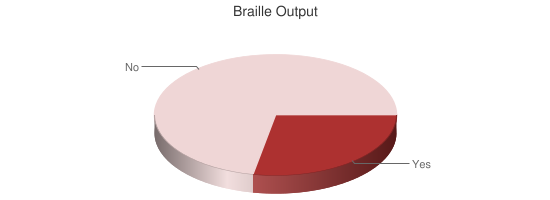
| Yes | 478 | 27.7% |
| No | 1245 | 72.3% |
The use of braille output has decreased only slightly since October 2009. As one would expect, the use of braille output is higher among respondents with a disability.
Visual Features
| Feature | # of Respondents | % of Respondents |
|---|---|---|
| Screen enlarger | 210 | 11.8% |
| Increased browser text sizes | 148 | 8.3% |
| Browser zoom | 129 | 7.2% |
| High contrast mode or style sheets | 152 | 8.5% |
307 respondents (17%) reported using at least one visual feature and most of these use a combination of multiple visual features.
Browsers
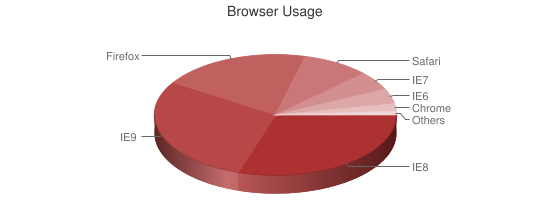
| Browser | # of Respondents | % of Respondents |
|---|---|---|
| Internet Explorer 8 | 530 | 30.4% |
| Internet Explorer 9+ | 497 | 28.5% |
| Firefox | 349 | 20.0% |
| Safari | 148 | 8.5% |
| Internet Explorer 7 | 88 | 5.1% |
| Internet Explorer 6 | 61 | 3.5% |
| Chrome | 42 | 2.4% |
| Others | 25 | 1.4% |
Respondent browser usage is largely unchanged over the last several years. Internet Explorer accounts for 67.5% of the browser share among respondents. This is significantly higher than that of the general population. Usage of Chrome is significantly below that of the general population, presumably due to lack of screen reader support in Chrome. Those without disabilities were much more likely than those with disabilities to use Firefox (31% compared to 19%) and Chrome (10% compared to 2%), and were less likely to use Internet Explorer (51.3% or respondents without disabilities compared to 68.6% of respondents with disabilities).
JavaScript Enabled
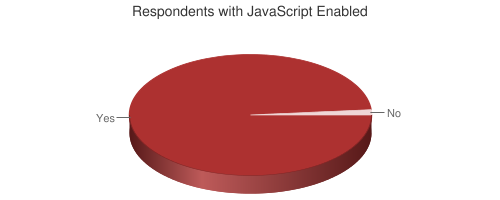
| JavaScript Enabled | % of Respondents |
|---|---|
| Yes | 98.6% |
| No | 1.4% |
Prevalence of JavaScript support was up only slightly from December 2010 (98.4%). 70% of those with JavaScript disabled were using Firefox (presumably with the NoScript add-on enabled) and 17% were using Lynx on Linux.
Screen Reader Customization
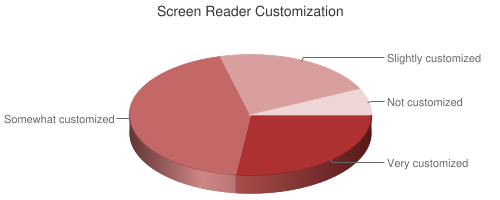
| Response | # of Respondents | % of Respondents |
|---|---|---|
| Very customized | 462 | 26.5% |
| Somewhat customized | 773 | 44.3% |
| Slightly customized | 389 | 22.3% |
| Not customized | 119 | 6.8% |
The amount of customization is almost identical to what was reported in January 2009. Those with disabilities were more than twice as likely to customize their screen readers than those without disabilities.
Free/Low-cost Screen Readers
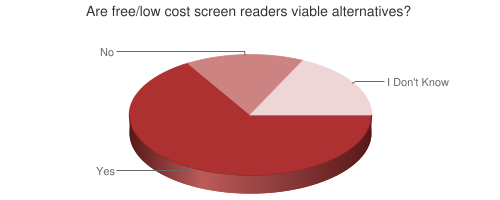
| Response | # of Respondents | % of Respondents |
|---|---|---|
| Yes | 1128 | 66.5% |
| No | 264 | 15.6% |
| I Don't Know | 304 | 17.9% |
47.8% answered "Yes" to this question in October 2009 and 60.4% in December 2010. The positive perception of free or low-cost screen readers is increasing.
Only 58% of JAWS users and 50% of Window-Eyes users answered "Yes" compared to an overwhelming 95% of NVDA users and 98% of VoiceOver users. Those that actually use free or low-cost screen readers have a much better perception of them than those who do not use them.
Mobile Screen Readers
Mobile Screen Reader Usage
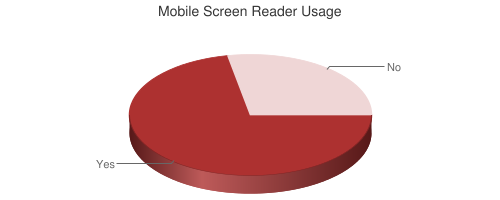
| Response | # of Respondents | % of Respondents |
|---|---|---|
| Yes | 1227 | 71.8% |
| No | 483 | 28.2% |
This represents a 600% increase in mobile screen reader usage in just over 3 years (only 12% reported using a mobile screen reader in January 2009), though a less significant increase over the 66.7% that reported using a mobile screen reader in December 2010. Those with advanced screen reader proficiency were much more likely to use a screen reader on a mobile device than those with low screen reader proficiency (81% to 49%). Respondents in North America were less likely to use a mobile screen reader than respondents from every other region represented (68% in North America compared to 82% in Europe/UK and 88% in Australia/Oceania, for example).
Mobile Platforms
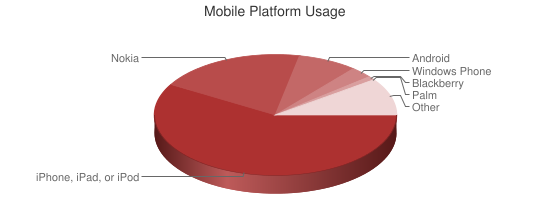
| Mobile Platform | # of Respondents | % of Respondents |
|---|---|---|
| Apple iPhone, iPad, or iPod touch | 814 | 58.5% |
| Nokia | 282 | 20.3% |
| Android | 110 | 7.9% |
| Windows Phone | 38 | 2.7% |
| Blackberry | 12 | 0.9% |
| Palm | 2 | 0.1% |
| Other | 134 | 9.6% |
In just 17 months, iOS devices increased significantly as the primary mobile platform from 32.6% to 58.5%. Android usage increased slightly (4% to 7.9%). Nokia device usage drastically fell in the same period (42.4% to 20.3%).
iOS device usage among screen reader users is notably higher than the smart phone usage for the standard population, whereas Android usage is much, much lower (estimates are that Android holds more than 50% of the smart phone market, yet only 8% of screen reader users use it). Additionally, 24% of those without disabilities use an Android device compared to only 6% of those with disabilities. This is a notable discrepancy that likely indicates lack of accessibility or interest in Android devices.
Nokia devices were much more popular than iOS devices in Africa/Middle East and Asia, whereas iOS devices were much more popular in Australia, Europe/UK, and especially North America (66% of North American respondents primarily use an iOS device compared to only 10% that use Nokia).
It is clear that iOS devices are winning the mobile screen reader battle. It is likely safe to assume that a notable percentage (perhaps as high as 5 or 10%) of iOS device owners are screen reader users. This perhaps provides some evidence of Apple's return on investment in native screen reader capabilities.
Mobile Screen Readers Used
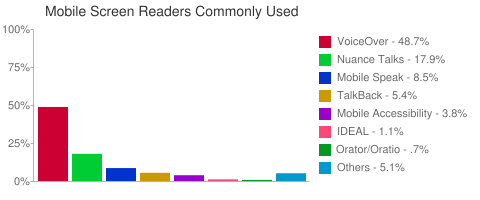
| Mobile Platform | # of Respondents | % of Respondents |
|---|---|---|
| VoiceOver | 868 | 48.7% |
| Nuance Talks | 319 | 17.9% |
| Mobile Speak | 152 | 8.5% |
| TalkBack for Android | 97 | 5.4% |
| Mobile Accessibility for Android | 67 | 3.8% |
| IDEAL | 19 | 1.1% |
| Orator/Oratio for BlackBerry | 21 | .7% |
| Other | 91 | 5.1% |
As with primary mobile screen readers, VoiceOver usage increased sharply since December 2010 (27.1% to 48.7%) while nearly every other mobile screen reader decreased in usage.
Web Accessibility Progress
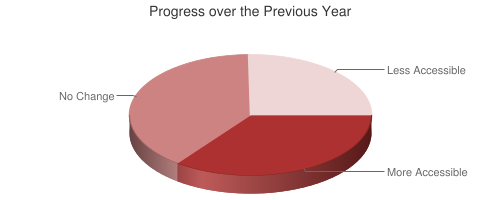
| Response | # of Respondents | % of Respondents |
|---|---|---|
| Web content has become more accessible | 600 | 35.2% |
| Web content accessibility has not changed | 675 | 39.6% |
| Web content has become less accessible | 429 | 25.2% |
Respondents have been continually less positive about progress in each successive survey - 25.2% of respondents this year thought web content has become less accessible, compared to 20.5% just 1.5 years ago.
ARIA Landmarks
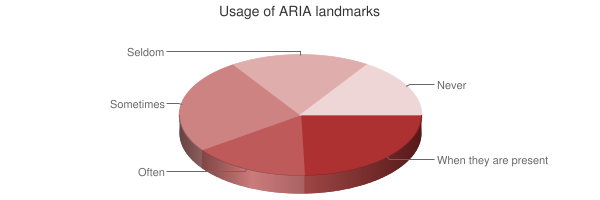
| Response | # of Respondents | % of Respondents |
|---|---|---|
| Whenever they are present | 408 | 24.6% |
| Often | 262 | 15.8% |
| Sometimes | 423 | 25.5% |
| Seldom | 307 | 18.5% |
| Never | 259 | 15.6% |
Compared to previous surveys, it appears that the knowledge of and use of landmarks has increased slightly.
Finding Information
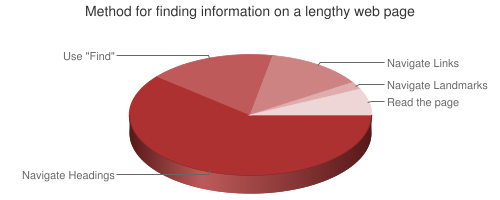
| Response | # of Respondents | % of Respondents |
|---|---|---|
| Navigate through the headings on the page | 1056 | 60.8% |
| Use the "Find" feature | 289 | 16.6% |
| Navigate through the links of the page | 230 | 13.2% |
| Navigate through the landmarks of the page | 40 | 2.3% |
| Read through the page | 122 | 7.0% |
The use of headings to find information has increased from 50.8% to 60.8% since October 2009. These responses show the prevalent use of headings. Those with advanced screen reader proficiency are more likely to use headings (66% use headings) than those with beginner proficiency (42% use headings). Conversely, those with advanced screen reader proficiency are much less likely to read through the page (5.4%) than those with beginner proficiency (18.4% read through the page).
Heading levels
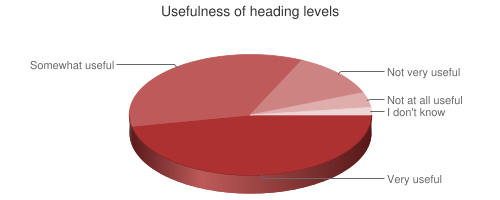
| Response | # of Respondents | % of Respondents |
|---|---|---|
| Very useful | 811 | 47.4% |
| Somewhat useful | 594 | 34.7% |
| Not very useful | 208 | 12.2% |
| Not at all useful | 60 | 3.5% |
| I don't know | 38 | 2.2% |
These responses show a very strong usefulness of appropriately structured heading levels.
"Skip" Links
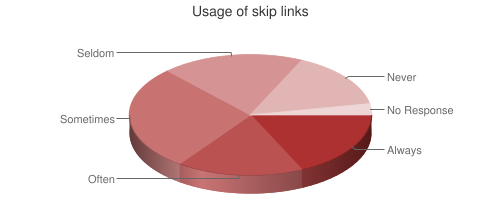
| Response | # of Respondents | % of Respondents |
|---|---|---|
| Whenever they're available | 323 | 18.1% |
| Often | 310 | 17.4% |
| Sometimes | 499 | 28.0% |
| Seldom | 333 | 18.7% |
| Never | 261 | 14.7% |
| No Response | 55 | 3.1% |
When compared to responses to the December 2010 survey, there has been a slight increase in the usage of "skip" links, though usage is very mixed. This increase in usage seems to be somewhat in conflict with the increase in the use of headings and landmarks as reported above.
CAPTCHA Difficulty
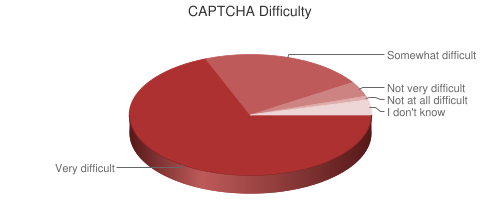
| Response | # of Respondents | % of Respondents |
|---|---|---|
| Very difficult | 1179 | 69.1% |
| Somewhat difficult | 367 | 21.5% |
| Not very difficult | 71 | 4.2% |
| Not at all difficult | 23 | 1.3% |
| I don't know | 65 | 3.8% |
Over 90% of respondents find CAPTCHA to be very or somewhat difficult.
Problematic Items
The survey asked respondents to select their most, second most, and third most problematic items from a list. In giving each selected item a weighting, the following chart shows the overall rating of difficulty and frustration for each item.
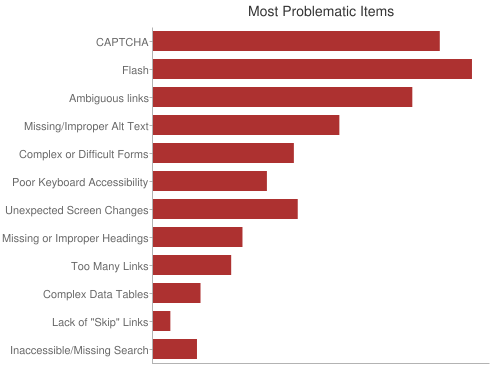
Problematic items identified are (in order, with most difficult/frustrating first):
- The presence of inaccessible Flash content
- CAPTCHA - images presenting text used to verify that you are a human user
- Links or buttons that do not make sense
- Images with missing or improper descriptions (alt text)
- Screens or parts of screens that change unexpectedly
- Complex or difficult forms
- Lack of keyboard accessibility
- Missing or improper headings
- Too many links or navigation items
- Complex data tables
- Inaccessible or missing search functionality
- Lack of "skip to main content" or "skip navigation" links
21.9% of respondents listed inaccessible Flash content as the most difficult or frustrating item encountered, with CAPTCHA (21.6%) closely behind. When compared to responses to these questions over 2.5 years ago, the order and indicated difficulty for the items in this list are largely unchanged.
Conclusion
The conclusion identified in the previous screen reader user surveys remains - there is no typical screen reader user. These results highlight significant changes and trends over a span nearly 3.5 years, results that we hope will drive informed web accessibility practices.
A few items of note:
- JAWS is still the primary screen reader, but usage continues to decrease as usage of NVDA and VoiceOver increases.
- The perception of free or low-cost screen readers is improving.
- The perception of accessibility of web content is decreasing.
- 72% of the respondents use a screen reader on a mobile device, up from only 12% three years ago.
- iOS device usage is significantly increasing and well above that of the standard population. Screen reader users represent a notable portion of the iOS device user market. Usage of Android devices is well below that of non-disabled users.
- The use of properly structured headings remains of great importance.
- The items that cause the most difficulty on the web remain largely unchanged over the last 2.5 years, with inaccessible Flash content and CAPTCHA being the most problematic.
Social Media Accessibility
Respondents report that social media sites are only slightly less accessible than was reported in December 2010.