Screen Reader User Survey #5 Results
Introduction
In January 2014, WebAIM conducted a survey of preferences of screen reader users. We received 1465 valid responses to this survey. This was a follow-up survey to the original WebAIM Screen Reader User Survey of January 2009 and the follow-up surveys from October 2009, December 2010, and May 2012. Additional surveys were conducted in July 2015 and October 2017.
A few disclaimers and notices:
- Totals may not equal 100% due to rounding.
- Total responses (n) for each question may not equal 1465 due to respondents not answering that particular question.
- The sample was not controlled and may not represent all screen reader users.
- We hope to conduct additional surveys of this nature again in the future. If you have recommendations or questions you would like us to ask, please contact us.
Demographics
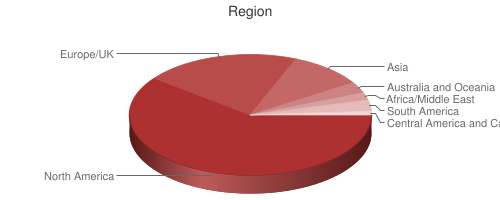
Region
| Response | # of Respondents | % of Respondents |
|---|---|---|
| North America | 878 | 61.4% |
| Europe/UK | 294 | 20.6% |
| Asia | 149 | 10.4% |
| Australia and Oceania | 46 | 3.2% |
| Africa/Middle East | 21 | 1.5% |
| South America | 36 | 2.5% |
| Central America and Caribbean | 5 | 0.3% |
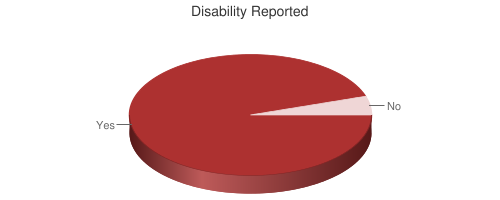
Disability Reported
| Response | # of Respondents | % of Respondents |
|---|---|---|
| Yes | 1377 | 95% |
| No | 75 | 5% |
Some have inquired about why our data includes both users with and without disabilities. In general, we've found survey question responses to be very similar across these two groups. Any notable differences are detailed below to help us determine differences in practices or perceptions between the disability and the developer communities.
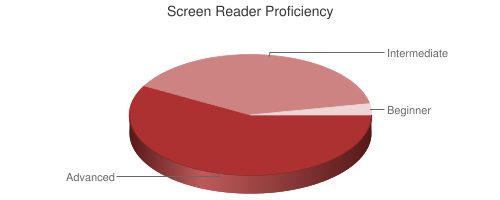
Screen Reader Proficiency
| Response | # of Respondents | % of Respondents |
|---|---|---|
| Advanced | 836 | 58% |
| Intermediate | 562 | 39% |
| Beginner | 48 | 3% |
Screen reader proficiency of respondents has increased slightly in each successive survey. Those who use screen readers due to a disability report themselves as being much more proficient with screen readers - 60% of those with disabilities considered their proficiency to be "Advanced" compared to only 20% of those without disabilities.
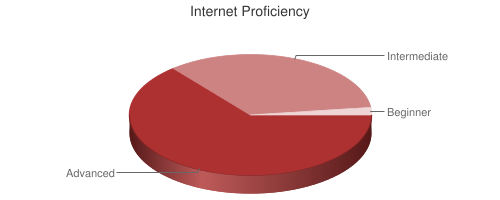
Internet Proficiency
| Response | # of Respondents | % of Respondents |
|---|---|---|
| Advanced | 920 | 64% |
| Intermediate | 495 | 34% |
| Beginner | 29 | 2% |
Internet proficiency has generally remained the same across all surveys.
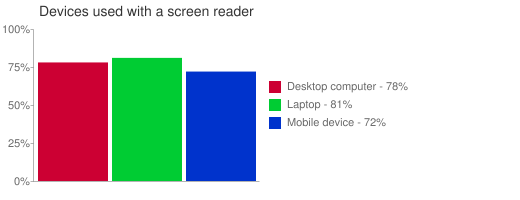
Devices Used
| Device | # of Respondents | % of Respondents |
|---|---|---|
| Desktop computer | 1148 | 78% |
| Laptop | 1184 | 81% |
| Mobile device | 1055 | 72% |
Mobile usage of screen readers continues to increase significantly - from 61% in May 2012 to 72% in January 2014. Desktop usage has slightly decreased while laptop usage has slightly increased and now outpaces desktop usage.
1232 (85%) of respondents use multiple devices. 698 respondents (48%) use a screen reader on all three devices. Only 12 respondents (less than 1%) report using a screen reader exclusively on a mobile device, so while mobile adoption is increasing, very few users are using mobile devices exclusively.
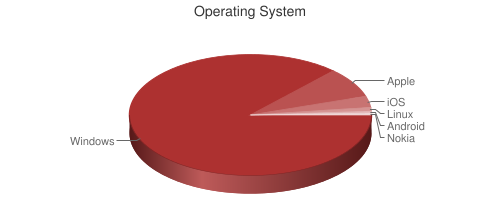
Operating System
| Response | # of Respondents | % of Respondents |
|---|---|---|
| Windows | 1213 | 82.8% |
| Apple | 125 | 8.5% |
| iOS | 65 | 4.4% |
| Linux | 17 | 1.2% |
| Android | 9 | 0.5% |
| Nokia | 23 | 1.6% |
Operating system data above was detected from the system used to complete the survey. Windows usage decreased from 87% to 82.8% since May 2012. Of the iOS devices, 35 were using iPhones, 25 were using iPads, and 5 were using iPods.
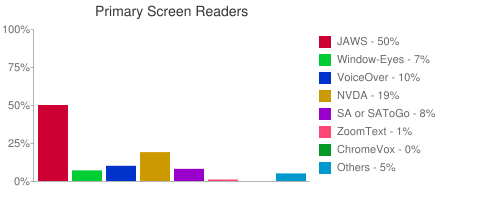
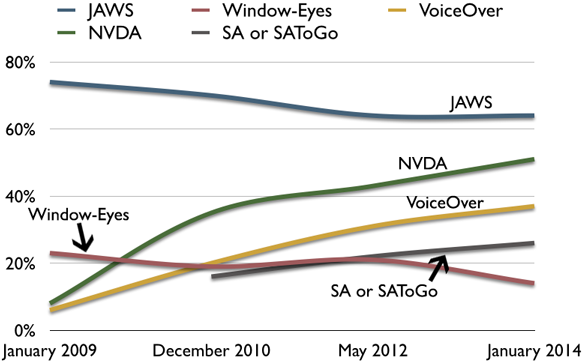
Primary Screen Reader
| Screen Reader | # of Respondents | % of Respondents |
|---|---|---|
| JAWS | 721 | 50.0% |
| Window-Eyes | 97 | 6.7% |
| VoiceOver | 149 | 10.3% |
| NVDA | 268 | 18.6% |
| System Access or System Access To Go | 111 | 7.7% |
| ZoomText | 19 | 1.3% |
| ChromeVox | 6 | 0.4% |
| Other | 70 | 4.9% |
While JAWS is still the most popular screen reader and has seen a significant decline in primary usage over the years, usage has stabilized since 2012 at around 50%. Window-Eyes saw its usage cut almost in half over the previous 19 months, from 12.3% in May 2012 to only 6.7% in January 2014. It will be interesting to see how Window-Eyes usage changes in the future now that it is available for Microsoft Office users. NVDA saw a notable increase and VoiceOver a minor increase. SA and ZoomText saw decreases in usage as a primary screen reader. While they were not listed for simplicity's sake, the survey comments indicate that Orca, SuperNova, and Speakup (among others) were common "Other" screen readers.
Regional differences are of note. JAWS was much more popular in Asia (65% of respondents) and North America (52%) than in Europe/UK (44%). NVDA was nearly 3 times more popular in Europe/UK than in North America.
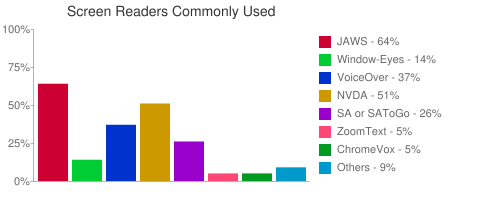
Screen Readers Commonly Used
| Screen Reader | # of Respondents | % of Respondents |
|---|---|---|
| JAWS | 936 | 63.9% |
| Window-Eyes | 203 | 13.9% |
| VoiceOver | 539 | 36.8% |
| NVDA | 750 | 51.2% |
| System Access or System Access To Go | 237 | 26.2% |
| ZoomText | 78 | 5.3% |
| ChromeVox | 70 | 4.8% |
| Other | 136 | 9.3% |
JAWS usage on desktop/laptop is now stable while NVDA, VoiceOver, and SystemAccess saw continued increases. Window-Eyes saw a notable decrease in usage since May 2012.
62% of respondents use more than one desktop/laptop screen reader. 27% use three or more, and 9% use four or more different screen readers.
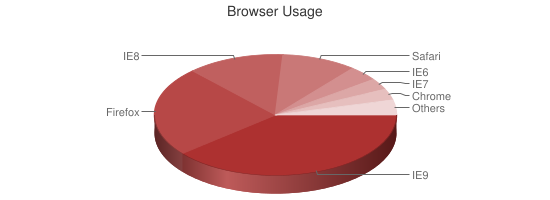
Browsers
| Browser | # of Respondents | % of Respondents |
|---|---|---|
| Internet Explorer 9+ | 556 | 38.9% |
| Firefox | 346 | 24.2% |
| Internet Explorer 8 | 180 | 12.6% |
| Safari | 143 | 10.0% |
| Internet Explorer 6 | 60 | 4.2% |
| Internet Explorer 7 | 43 | 3.0% |
| Chrome | 40 | 2.8% |
| Others | 58 | 4.1% |
Internet Explorer usage decreased from 67.5% in May 2012 to 58.7% in January 2014, but is still the most commonly used browser. This is significantly higher than that of the general population (most statistics place it at around 20%). 7.2% of respondents still use IE6 or IE7, compared to just .5% of the general population.
Usage of Chrome at 2.8% is very significantly below the 42% usage of the general population, presumably due to lack of screen reader support in Chrome (ChromeVox excluded, though only .4% of respondents use ChromeVox as their primary screen reader).
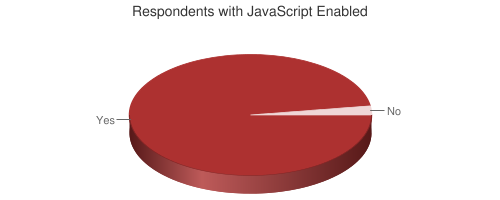
JavaScript Enabled
| JavaScript Enabled | % of Respondents |
|---|---|
| Yes | 97.6% |
| No | 2.4% |
Prevalence of JavaScript being enabled was down only slightly from May 2012 (98.6%). The vast majority of those with JavaScript disabled were using Firefox (presumably with the NoScript add-on enabled) or were using Lynx on Linux.
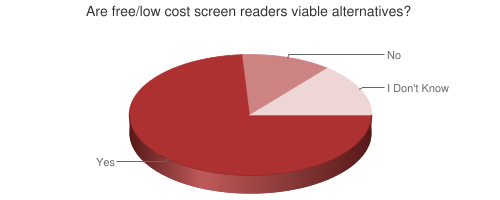
Free/Low-cost Screen Readers
| Response | # of Respondents | % of Respondents |
|---|---|---|
| Yes | 1036 | 73.5% |
| No | 175 | 12.4% |
| I Don't Know | 199 | 14.1% |
The positive perception of free or low-cost screen readers continues to increase. Positive responses to this question were 48% in October 2009, 60% in December 2010, 67% in May 2012, and 74% in January 2014.
Only 65% of JAWS users and 58% of Window-Eyes users answered "Yes" (these numbers continue to increase each year) compared to an overwhelming 94% of VoiceOver users, 93% of NVDA users, and 72% of SystemAccess users. Those that actually use free or low-cost screen readers have a much better perception of them than those who do not use them. Respondents with "Advanced" screen reader proficiency were also more favorable of free/low-cost screen readers.
Mobile Screen Readers
Mobile Screen Reader Usage
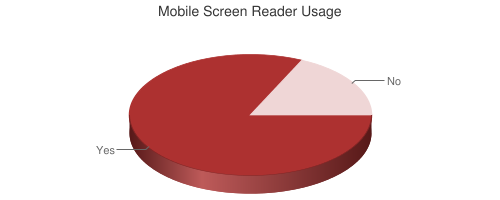
| Response | # of Respondents | % of Respondents |
|---|---|---|
| Yes | 1173 | 82% |
| No | 257 | 18% |
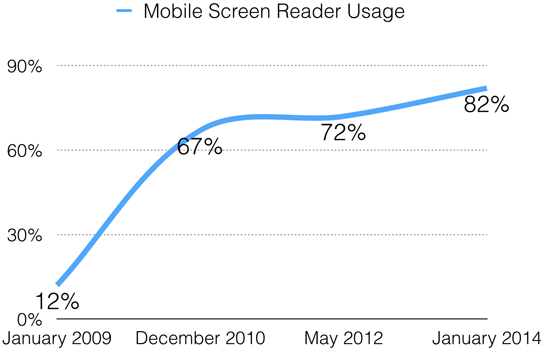
The increase in mobile screen reader usage continues to astound. Only 12% reported using a mobile screen reader in January 2009 compared to 82% just five years later.
Those with advanced screen reader proficiency were much more likely to use a screen reader on a mobile device than those with low screen reader proficiency (90% compared to 53%). Respondents in North America were less likely to use a mobile screen reader than respondents from nearly every other region represented.
Mobile Platforms
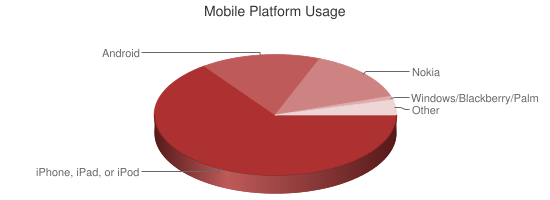
| Mobile Platform | # of Respondents | % of Respondents |
|---|---|---|
| Apple iPhone, iPad, or iPod touch | 816 | 65.2% |
| Android | 200 | 16.0% |
| Nokia | 177 | 14.3% |
| Windows Phone | 4 | 0.3% |
| Blackberry | 4 | 0.3% |
| Palm | 1 | 0.1% |
| Other | 49 | 3.9% |
iOS usage continued its increase from 32.6% in December 2010 to 58.5% in May 2012 to 65.2% in January 2014. Android usage doubled in the previous 19 months (7.9% to 16.0%) while Nokia device usage decreased (20.3% to 14.3%, down from 42.4% in December 2010). Windows Phone, Blackberry, and Palm combined represent less than 1% of usage.
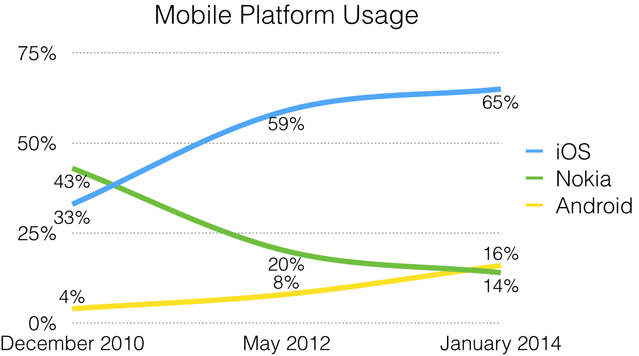
iOS device usage among screen reader users is notably higher than for the standard population, whereas Android usage is much, much lower. Those with more advanced screen reader and internet proficiency were much more likely to use iOS over Android or Nokia.
Mobile Screen Readers Used
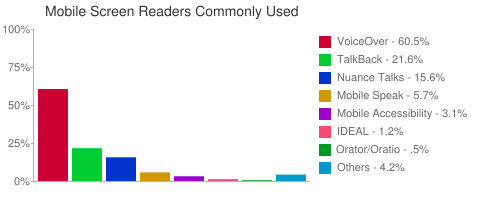
| Mobile Platform | # of Respondents | % of Respondents |
|---|---|---|
| VoiceOver | 886 | 60.5% |
| TalkBack for Android | 316 | 21.6% |
| Nuance Talks | 228 | 15.6% |
| Mobile Speak | 83 | 5.7% |
| Mobile Accessibility for Android | 46 | 3.1% |
| IDEAL | 17 | 1.2% |
| Orator/Oratio for BlackBerry | 7 | .5% |
| Other | 62 | 4.2% |
As with primary mobile screen readers, VoiceOver and Android screen reader usage increased while nearly every other mobile screen reader decreased in usage. 21% of respondents commonly use multiple mobile screen readers.
Mobile vs. Desktop/Laptop Usage
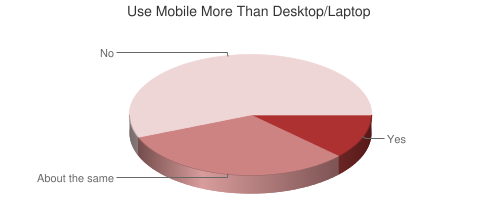
| Response | # of Respondents | % of Respondents |
|---|---|---|
| Yes | 160 | 12% |
| About the same | 432 | 32% |
| No | 753 | 56% |
44% of respondents use mobile screen readers more than or about as much as desktop/laptop screen readers.
Web Accessibility Progress
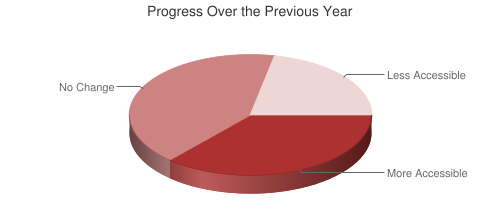
| Response | # of Respondents | % of Respondents |
|---|---|---|
| Web content has become more accessible | 520 | 36.7% |
| Web content accessibility has not changed | 587 | 41.5% |
| Web content has become less accessible | 309 | 21.8% |
For the first time in 5 years of surveys, respondents are more positive about web accessibility progress than in the previous survey. Only 21.8% thought web content has become less accessible, compared to 25.2% in May 2012.
Impacts on Accessibility
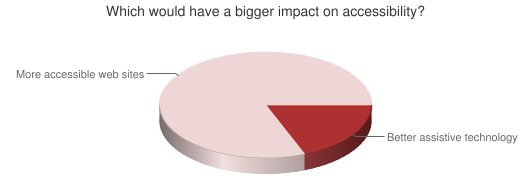
| Response | # of Respondents | % of Respondents |
|---|---|---|
| Better (more accessible) web sites | 1166 | 81.3% |
| Better assistive technology | 268 | 18.7% |
Over time, more respondents have answered "better web sites" to this question - 68.6% of respondents in October 2009, 75.8% in December 2010, and now 81.3% in January 2014. This change perhaps reflects improvements to assistive technology. It certainly indicates that users expect site authors to address accessibility.
Text-only or Screen Reader Versions
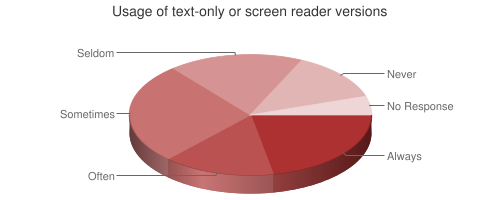
| Response | # of Respondents | % of Respondents |
|---|---|---|
| Whenever they're available | 338 | 23.1% |
| Often | 264 | 18.0% |
| Sometimes | 383 | 26.1% |
| Seldom | 275 | 18.8% |
| Never | 154 | 10.5% |
| No Response | 51 | 3.5% |
These responses are largely unchanged from previous surveys, though users are slightly more likely to use text-only or screen reader versions now than in the past. Only 17% of those without disabilities reported using text-only or screen reader versions often or whenever they're available compared to 43% of those with disabilities. This may suggest that those with disabilities find greater usage in text-only or screen reader versions than those without disabilities might think or hope. Despite this, the fact that so many users seldom or never use such sites suggests that this approach to accessibility is not optimal.
Breadcrumbs
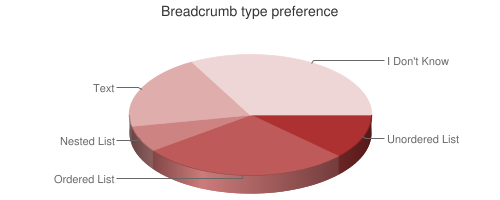
| Response | # of Respondents | % of Respondents |
|---|---|---|
| #1 - Unordered List | 156 | 11.9% |
| #2 - Ordered List | 364 | 27.8% |
| #3 - Nested List | 96 | 7.3% |
| #4 - Text | 268 | 20.4% |
| I Don't Know | 427 | 32.6% |
Of respondents that had a preference (that so many didn't know is insightful - perhaps because the unordered and ordered lists examples are presented identically in some screen readers), most preferred an ordered list or plain text over an unordered list or nested list. Those without disabilities were twice as likely to prefer nested lists (by far the most complex of the presentations) than those with disabilities.
Screen Reader Detection
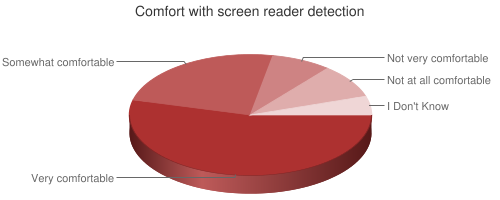
| Response | # of Respondents | % of Respondents |
|---|---|---|
| Very comfortable | 767 | 54.0% |
| Somewhat comfortable | 346 | 24.4% |
| Not very comfortable | 117 | 8.2% |
| Not at all comfortable | 122 | 8.6% |
| I don't know | 68 | 4.8% |
The vast majority (78.4%) of screen reader users are very or somewhat comfortable with allowing screen reader detection. 55.4% of those with disabilities indicated they were very comfortable with screen reader detection compared to 31.4% of respondents without disabilities.
Screen Reader Detection for Better Accessibility
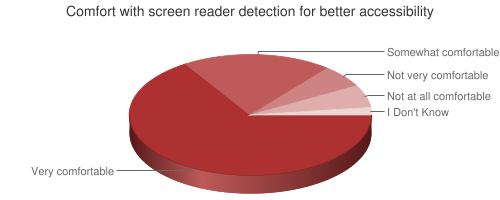
| Response | # of Respondents | % of Respondents |
|---|---|---|
| Very comfortable | 936 | 66.4% |
| Somewhat comfortable | 284 | 20.1% |
| Not very comfortable | 78 | 5.5% |
| Not at all comfortable | 81 | 5.7% |
| I don't know | 31 | 2.2% |
86.5% of respondents were very or somewhat comfortable with allowing screen reader detection if it resulted in better accessibility. Historically, there has generally been resistance to web technologies that would detect assistive technologies - primarily due to privacy concerns and fear of discrimination. These responses clearly indicate that the vast majority of users are comfortable with revealing their usage of assistive technologies, especially if it results in a more accessible experience.
Reasons for Inaccessibility
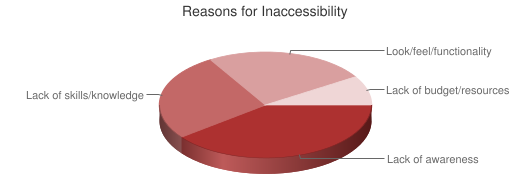
| Response | # of Respondents | % of Respondents |
|---|---|---|
| Lack of awareness of web accessibility | 566 | 39.6% |
| Lack of web accessibility skills or knowledge | 392 | 27.4% |
| Fear that accessibility will hinder the look, feel, or functionality | 350 | 24.5% |
| Lack of budget or resources to make it accessible | 122 | 8.5% |
Responses were virtually identical to those given to the October 2009 survey. Those with disabilities were much more likely to attribute poor accessibility to lack of awareness, whereas those without disabilities (presumably developers) predominantly attributed it to lack of skills or knowledge.
Landmarks/Regions
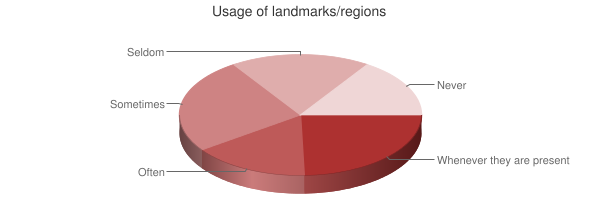
| Response | # of Respondents | % of Respondents |
|---|---|---|
| Whenever they are present | 354 | 25.5% |
| Often | 254 | 18.3% |
| Sometimes | 388 | 28.0% |
| Seldom | 209 | 15.1% |
| Never | 182 | 13.1% |
Compared to previous surveys, the knowledge of and use of landmarks has increased slightly. 48% of JAWS users always or often navigate by landmarks, compared to 41.4% of NVDA users and 34.9% of VoiceOver users.
Number of Landmarks/Regions
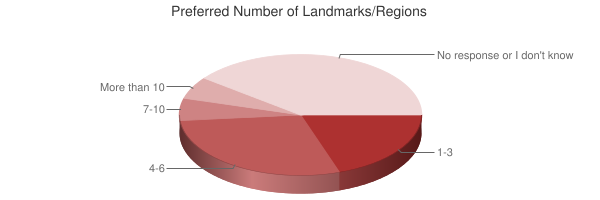
| Response | # of Respondents | % of Respondents |
|---|---|---|
| 1-3 | 292 | 19.9% |
| 4-6 | 420 | 28.7% |
| 7-10 | 82 | 5.6% |
| More than 10 | 82 | 5.6% |
| No response or I don't know | 589 | 40.2% |
Most respondents favor few landmarks/regions per page. Of note is that over 40% of respondents didn't respond or didn't know.
Finding Information
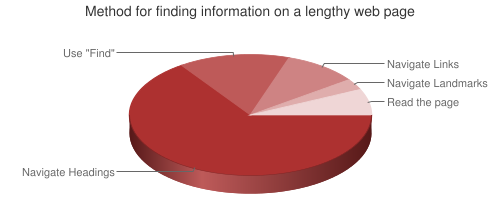
| Response | # of Respondents | % of Respondents |
|---|---|---|
| Navigate through the headings on the page | 941 | 65.6% |
| Use the "Find" feature | 218 | 15.2% |
| Navigate through the links of the page | 140 | 9.8% |
| Navigate through the landmarks of the page | 40 | 2.8% |
| Read through the page | 96 | 6.7% |
Reliance on headings as the predominant mechanism for finding page information continues to increase - 50.8% in October 2009, 60.8% in May 2012, and 65.6% in January 2014. While 43.8% of respondents indicate that they always or often use landmarks when they are present, only 2.8% use this method for finding information on a lengthy web page. Those with advanced screen reader proficiency are more likely to use headings (71% use headings) than those with beginner proficiency (43% use headings).