Screen Reader User Survey #6 Results
Introduction
In July 2015, WebAIM conducted a survey of preferences of screen reader users. We received 2515 valid responses to this survey, our highest thus far. This was a follow-up survey to the original WebAIM Screen Reader User Survey of January 2009 and the follow-up surveys from October 2009, December 2010, May 2012, and January 2014. An additional survey was conducted October 2017
A few disclaimers and notices:
- Totals may not equal 100% due to rounding.
- Total responses (n) for each question may not equal 2515 due to respondents not answering that particular question.
- The sample was not controlled and may not represent all screen reader users.
- We hope to conduct additional surveys of this nature again in the future. If you have recommendations or questions you would like us to ask, please contact us.
Demographics
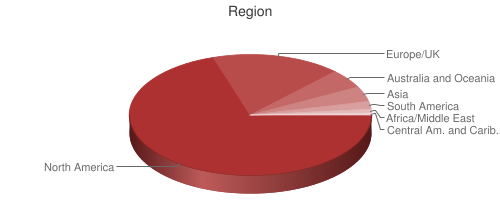
Region
| Response | # of Respondents | % of Respondents |
|---|---|---|
| North America | 1680 | 69.4% |
| Europe/UK | 422 | 17.4% |
| Australia and Oceania | 131 | 5.4% |
| Asia | 103 | 4.3% |
| South America | 41 | 1.7% |
| Africa/Middle East | 35 | 1.4% |
| Central America and Caribbean | 9 | 0.4% |
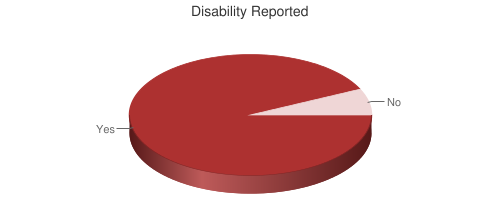
Disability Reported
| Response | # of Respondents | % of Respondents |
|---|---|---|
| Yes | 2307 | 93.1% |
| No | 171 | 6.9% |
Some have inquired about why our data includes both users with and without disabilities. In general, we've found survey question responses to be very similar across these two groups. Any notable differences are detailed below to help us determine differences in practices or perceptions between the disability and the developer communities.
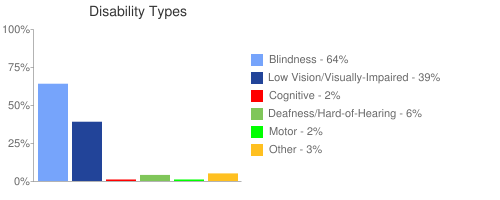
Disability Types
| Response | # of Respondents | % of Respondents |
|---|---|---|
| Blindness | 1610 | 64% |
| Low Vision/Visually-Impaired | 973 | 38.7% |
| Cognitive | 44 | 1.7% |
| Deafness/Hard-of-Hearing | 157 | 6.2% |
| Motor | 60 | 2.4% |
| Other | 65 | 2.6% |
406 respondents (16.1%) reported multiple disabilities. 103 respondents (4.1%) reported being both deaf and blind.
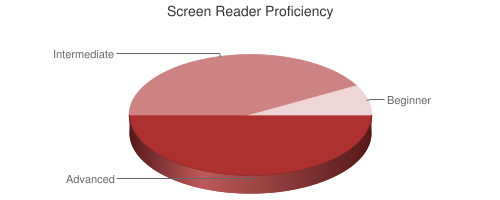
Screen Reader Proficiency
| Response | # of Respondents | % of Respondents |
|---|---|---|
| Advanced | 1232 | 50% |
| Intermediate | 1029 | 42% |
| Beginner | 189 | 8% |
Screen reader proficiency reported on this survey is notably lower than previous surveys (50% indicate advanced proficiency compared to 58% in 2014). We believe this shift is largely due to the broader number of survey respondents. In short, the survey was distributed more widely and to less proficient users. This likely indicates that the responses to this survey are more reflective of the broader screen reader community.
Those who use screen readers due to a disability report themselves as more proficient with screen readers - 52% of those with disabilities considered their proficiency to be "Advanced" compared to only 28% of those without disabilities.
Internet Proficiency
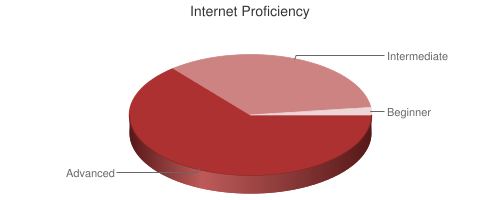
| Response | # of Respondents | % of Respondents |
|---|---|---|
| Advanced | 1479 | 60% |
| Intermediate | 907 | 37% |
| Beginner | 76 | 3% |
Internet proficiency has generally remained similar across all surveys. Those without disabilities rate themselves as more proficient than those with disabilities.
Level of Employment
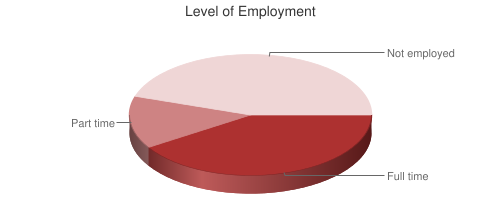
| Response | # of Respondents | % of Respondents |
|---|---|---|
| Employed full time | 986 | 40.7% |
| Employed part time | 338 | 13.9% |
| Not employed | 1101 | 45.4% |
While retirement or respondents too young to work were not considered in these numbers, these results certainly reflect the significant unemployment and under-employment of individuals with disabilities. However, the number or respondents who reported a disability that are unemployed (47.3%) is notably lower than the 62.3% unemployment rate for working age adults with significant vision loss as reported by the NFB in 2012.
73.4% of those without disabilities were employed full time compared to only 38.3% of those with disabilities. Respondents with higher screen reader and internet proficiency were more likely to be employed.
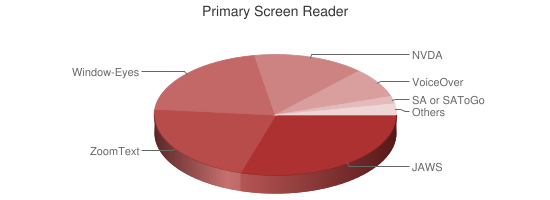
Primary Screen Reader
| Screen Reader | # of Respondents | % of Respondents |
|---|---|---|
| JAWS | 743 | 30.2% |
| ZoomText | 545 | 22.2% |
| Window-Eyes | 508 | 20.7% |
| NVDA | 360 | 14.6% |
| VoiceOver | 188 | 7.6% |
| System Access or System Access To Go | 36 | 1.5% |
| ChromeVox | 8 | 0.3% |
| Other | 72 | 2.9% |
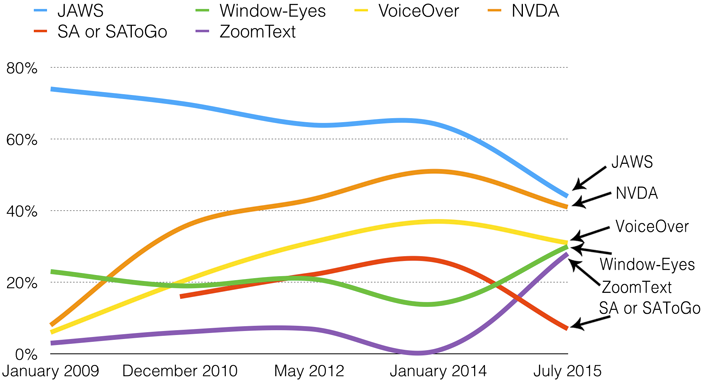
The following chart shows historical trends for primary screen reader usage.
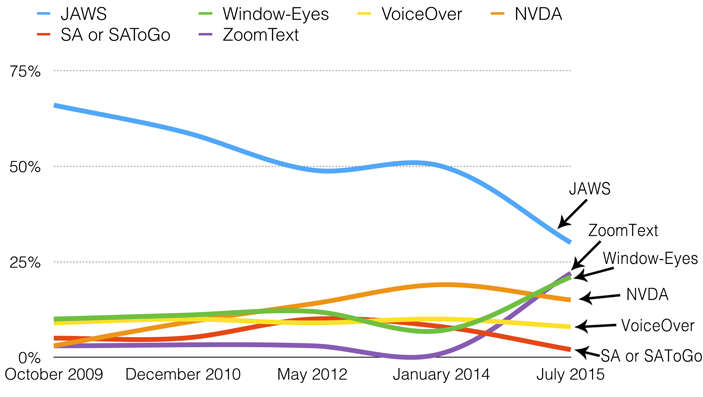
ZoomText (1.3% to 22.2%) and Window-Eyes (6.7% to 20.7%) both saw very significant increases in usage since January 2014. This reflects a very substantial decrease in JAWS usage since January 2014 - from 50% to 30%. JAWS has seen a continual decrease in usage over time from a high of 74% on our first survey in 2009. VoiceOver and NVDA have also seen slight decreases in usage. Much of the Window-Eyes increase can likely be attributed to its free availability to Microsoft Office users. The ZoomText increase is both notable and surprising. Is is used as a primary screen reader as often as both NVDA (14.6%) and VoiceOver (7.6%) combined. While they were not listed as response options for simplicity's sake, the survey comments indicate that Orca, SuperNova, and Speakup (among others) were common "Other" screen readers.
For respondents that report blindness, 38.9% use JAWS, 26.5% use Window-Eyes, 16.9% use NVDA, 8.7% use VoiceOver, and 4.6% use ZoomText. For respondents that report having low vision, 53.5% use ZoomText, 16.5% use JAWS, 12.2% use Window-Eyes, 8.7% use NVDA, and 4.6% use VoiceOver. ZoomText was also more commonly used by users with auditory, motor, and cognitive disabilities than by users with blindness.
Respondents with lower screen reader proficiency were much more likely to use ZoomText than any other screen reader whereas those with advanced proficiency favored JAWS. Respondents with disabilities were twice as likely to use Window-Eyes as those without disabilities.
Read additional commentary on the increase of ZoomText and Window-Eyes on our blog at http://webaim.org/blog/resugence-of-zoomtext-and-window-eyes/. We believe these data indicate a significant shift in the field.
Browsers
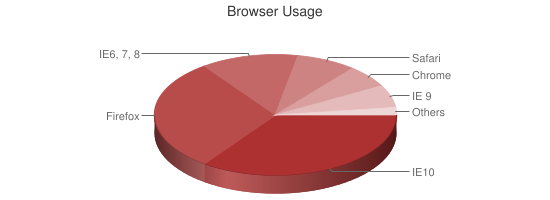
| Browser | # of Respondents | % of Respondents |
|---|---|---|
| Internet Explorer 10+ | 852 | 34.9% |
| Firefox | 735 | 30.1% |
| Internet Explorer 6, 7, or 8 | 313 | 12.8% |
| Safari | 192 | 7.9% |
| Chrome | 155 | 6.3% |
| Internet Explorer 9 | 142 | 5.8% |
| Others | 54 | 2.2% |
Internet Explorer (all versions) usage decreased to 53.5% from 58.7% in January 2014 and 67.5% in May 2012, but it is still the most commonly used browser. This is a significantly higher usage of IE than that of the general population (most statistics place it around 10%). 12.8% of respondents still use IE6, 7, or 8 - notable due to the lack of ARIA support in these browser versions. Chrome usage at 6.4% (up from 2.8% in January 2014) is just a fraction of the overall usage of Chrome in the general population. Firefox usage was up in the last 18 months (24.2% to 30.1%) and Safari usage was down (10.0% to 7.9%).
Screen Reader / Browser Combinations
If you don't consider versions of Internet Explorer, the most common combinations are:
- JAWS with IE - 23.9%
- Window-Eyes with IE - 14.9%
- NVDA with Firefox - 11.4%
- ZoomText with IE - 9.8%
- ZoomText with Firefox - 6.9%
- VoiceOver with Safari - 6.8%
| Browser | # of Respondents | % of Respondents |
|---|---|---|
| JAWS with Internet Explorer 10+ | 401 | 16.6% |
| NVDA with Firefox | 275 | 11.4% |
| Window-Eyes with Internet Explorer 10+ | 218 | 9.0% |
| ZoomText with Firefox | 166 | 6.9% |
| VoiceOver with Safari | 165 | 6.8% |
| ZoomText with Internet Explorer 10+ | 139 | 5.8% |
| JAWS with Firefox | 137 | 5.7% |
| JAWS with Internet Explorer 6, 7, or 8 | 116 | 4.8% |
| Window-Eyes with Firefox | 113 | 4.7% |
| Window-Eyes with Internet Explorer 6, 7, or 8 | 108 | 4.5% |
| ZoomText with Chrome | 95 | 3.9% |
| Other combinations | 477 | 19.8% |
There are many combinations that are used. This highlights the need for increased screen reader and browser support for web standards because of the great difficulty for web authors to test in all common screen reader / browser combinations.
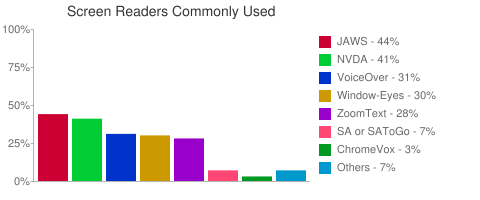
Screen Readers Commonly Used
| Screen Reader | # of Respondents | % of Respondents |
|---|---|---|
| JAWS | 1098 | 43.7% |
| NVDA | 1040 | 41.4% |
| VoiceOver | 778 | 30.9% |
| Window-Eyes | 745 | 29.6% |
| ZoomText | 691 | 27.5% |
| System Access or System Access To Go | 173 | 6.9% |
| ChromeVox | 71 | 2.8% |
| Other | 163 | 6.5% |
JAWS usage is down from 63.9% in January 2014 to 43.7% (from a high of 74% in January 2009). Window-Eyes usage doubled and ZoomText usage increased over 5 times in the last 18 months! System Access (26.2% to 6.9%), NVDA (from 51.2% to 41.4%), VoiceOver (from 36.8% to 30.9%), and ChromeVox (4.8% to 2.8%) all saw notable decreases in usage in that time.
It is both exciting and challenging that there are 5 different screen readers that are nearing parity of common usage by over 25% of respondents. If these trends continue, it's quite possible that JAWS will no longer be the most commonly used screen reader in the near future.
53% of respondents use more than one desktop/laptop screen reader. This is down from 62% in January 2014. 25% use three or more, and 9% use four or more different screen readers. 66% of VoiceOver users commonly use additional screen readers - of note seeing as the other screen readers run almost exclusively on Windows. On the other hand, Window-Eyes (37%) and ZoomText (only 22%) users were much less likely to use additional screen readers. This disparity explains why ZoomText is used as a primary screen reader by 22.2% of respondents, but is commonly used less frequently than both NVDA and VoiceOver.
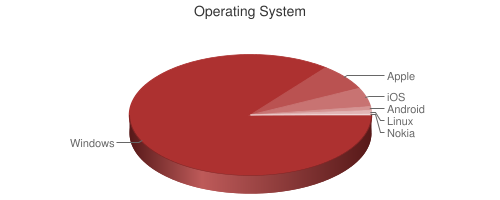
Operating System
| Response | # of Respondents | % of Respondents |
|---|---|---|
| Windows | 2140 | 85.3% |
| Apple | 171 | 6.8% |
| iOS | 134 | 5.3% |
| Android | 33 | 1.3% |
| Linux | 26 | 1.0% |
| Nokia | 4 | .2% |
Operating system data above was detected from the system used to complete the survey. Windows usage is up slightly (82.8% to 85.3%) since January 2014, while Apple usage is down slightly (8.5% to 6.8%). iOS and Android usage both increased slightly. Of the iOS devices, 89 were using iPhones, 43 were using iPads, and 2 were using iPods. Respondents without disabilities were more likely to use Apple, Android, and iOS than those without disabilities who were more likely to use Windows. Those with beginner screen reader proficiency were much more likely to be using a mobile device than those with advanced proficiency.
Home vs. Work
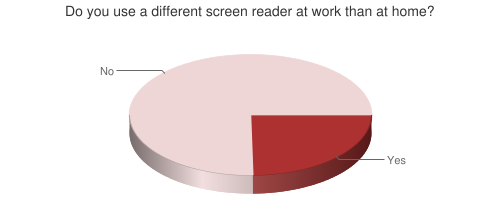
| Response | # of Respondents | % of Respondents |
|---|---|---|
| No | 1229 | 75.3% |
| Yes | 403 | 24.7% |
86.5% of ZoomText users and 79.5% of JAWS users use the same screen reader at home and work compared to 57% of VoiceOver users.
Screen Reader Updates
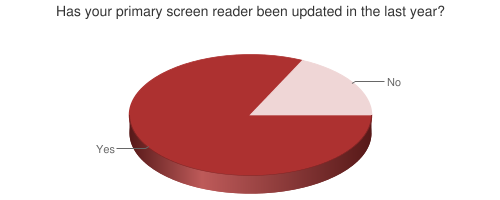
| Response | # of Respondents | % of Respondents |
|---|---|---|
| Yes | 1998 | 82.1% |
| No | 435 | 17.9% |
The percentage of respondents updating in the previous year is largely unchanged from previous surveys. It's important to note that many users may still be using screen readers that are several years old.
Primary users of NVDA (96.1%), VoiceOver (91.7%), and Window-Eyes (91.6%) were most likely to have updated in the previous year - understandable because these updates generally are free. 80.1% of JAWS users and only 65.3% of ZoomText users have updated in the previous year.
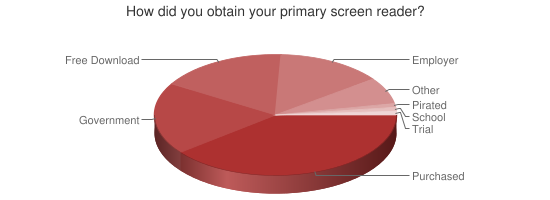
How Obtained
| Response | # of Respondents | % of Respondents |
|---|---|---|
| I bought it myself | 952 | 39.0% |
| It was received through a government program | 474 | 19.4% |
| I downloaded it free of charge from the Internet | 425 | 17.4% |
| It was provided to me by my employer | 330 | 13.5% |
| Other | 176 | 7.2% |
| I'm using a pirated version of a commercial screen reader | 34 | 1.4% |
| It was provided to me by my school | 28 | 1.1% |
| I'm using a trial version of a commercial screen reader | 22 | 0.9% |
More respondents are purchasing their own screen readers now (39.0%) than in October 2009 (34.7%). 40.3% of those with disabilities purchased their own screen reader as compared to only 17% of those without disabilities.
Mobile Screen Readers
Mobile Screen Reader Usage
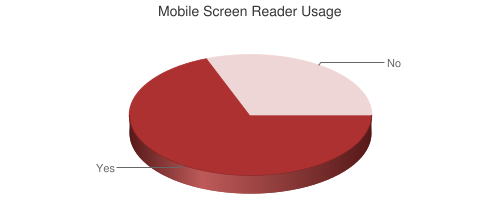
| Response | # of Respondents | % of Respondents |
|---|---|---|
| Yes | 1683 | 69.2% |
| No | 750 | 30.8% |
The percentage of respondents using a mobile screen reader is down to 69.2% from 82% in January 2014. This decrease is almost at levels reported in December 2010.
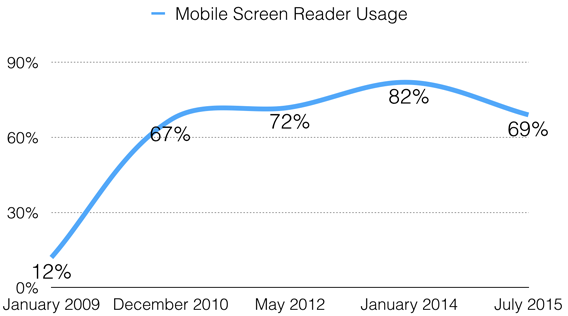
This decrease is likely explained primarily by the broader dissemination of the survey to a more diverse and less technically proficient user base - particularly users with low vision. 83.7% of users with advanced screen reader proficiency use a mobile screen reader compared to just 41.2% of those with beginner proficiency. 80.2% of blind respondents use a mobile device compared to only 52.8% of low vision users. Those without disabilities were also much less likely to use a mobile screen reader and fewer respondents reported having disabilities than in previous years.
Mobile Platforms
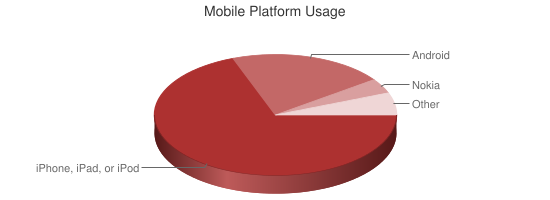
| Mobile Platform | # of Respondents | % of Respondents |
|---|---|---|
| Apple iPhone, iPad, or iPod touch | 1443 | 69.6% |
| Android | 430 | 20.8% |
| Nokia | 79 | 3.8% |
| Other | 120 | 5.8% |
iOS usage has continued to increase. Android usage also increased though at a slower pace than previous years. Nokia usage is now quite rare. Windows Phone, Blackberry, Palm, and other platforms combined represent less than 6% of usage.
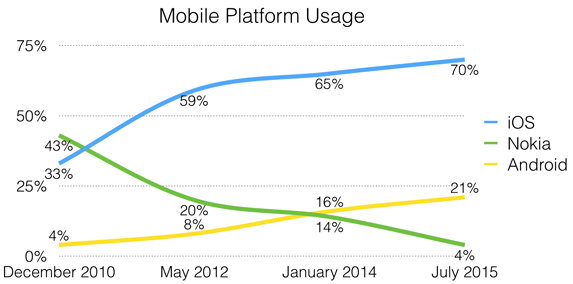
iOS device usage among screen reader users is notably higher than for the standard population, whereas Android usage is much, much lower. Those with more advanced screen reader and internet proficiency were much more likely to use iOS over Android or Nokia. Those without disabilities were more than twice as likely to use Android as those with disabilities.
Mobile Screen Readers Used
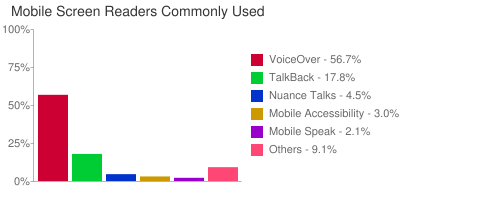
| Mobile Platform | # of Respondents | % of Respondents |
|---|---|---|
| VoiceOver | 1426 | 56.7% |
| TalkBack for Android | 448 | 17.8% |
| Nuance Talks | 114 | 4.5% |
| Mobile Accessibility for Android | 76 | 3.0% |
| Mobile Speak | 54 | 2.1% |
| Other | 62 | 9.1% |
VoiceOver usage decreased from 60.5% in January 2014. 13% of respondents commonly use multiple mobile screen readers.
The following chart show mobile screen reader usage over time.

Web Accessibility Progress
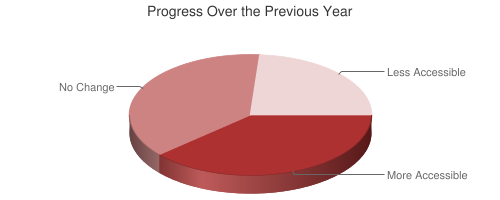
| Response | # of Respondents | % of Respondents |
|---|---|---|
| Web content has become more accessible | 928 | 38.7% |
| Web content accessibility has not changed | 902 | 37.7% |
| Web content has become less accessible | 565 | 23.6% |
Responses to this question are very similar to previous years. Respondents without disabilities tend to be more positive about recent progress than those with disabilities.
Reasons for Inaccessibility
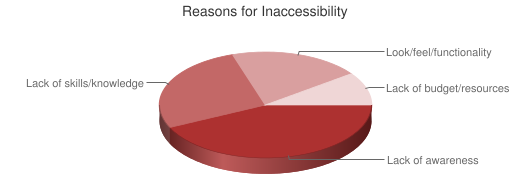
| Response | # of Respondents | % of Respondents |
|---|---|---|
| Lack of awareness of web accessibility | 1031 | 43.0% |
| Lack of web accessibility skills or knowledge | 638 | 26.6% |
| Fear that accessibility will hinder the look, feel, or functionality | 487 | 20.3% |
| Lack of budget or resources to make it accessible | 242 | 10.1% |
When compared to answers from previous surveys, respondents this year were more likely to indicate lack of awareness (43% compared to 38% in 2009) as the primary reason for inaccessibility.
Landmarks/Regions
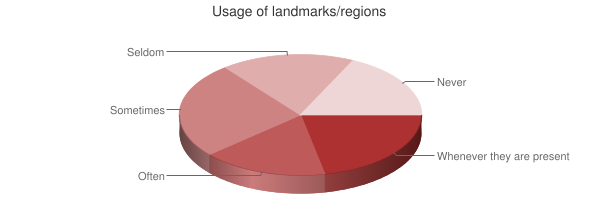
| Response | # of Respondents | % of Respondents |
|---|---|---|
| Whenever they are present | 515 | 22.1% |
| Often | 385 | 16.5% |
| Sometimes | 599 | 25.7% |
| Seldom | 416 | 17.9% |
| Never | 414 | 17.8% |
Compared to previous surveys, the knowledge and use of landmarks has decreased slightly. 45.4% of JAWS users, 43.1% of NVDA users, 37.1% of Window-Eyes users, and 36.9% of VoiceOver users always or often use landmarks. However, only 28% of ZoomText users do the same - not unexpected seeing as ZoomText did not support landmark navigation until just a few weeks before this survey concluded. 44.2% of respondents with advanced screen reader proficiency always or often use landmarks compared to 29.4% of those with beginner screen reader proficiency.
Complex Images
| Response | # of Respondents | % of Respondents |
|---|---|---|
| As optional text, available on the same page but only if I request it by following a link | 1021 | 43.5% |
| As text on the web page, immediately following the image | 605 | 25.8% |
| As a lengthy description (alt text) on the image itself | 355 | 15.1% |
| On a separate page, available by following a link | 161 | 6.9% |
| On a separate page, announced by and available to my screen reader | 137 | 5.8% |
| Ignored entirely by my screen reader | 68 | 2.9% |
This is a follow-up to a question asked on the October 2009 survey. The most preferred method for long description is optional text available on request on the same page. Interestingly, this is probably the least common approach and the only one that is not natively supported by user agents using any standard, semantic markup available today. The option of placing the alternative on a separate page but having it announced by the screen reader, the most common current behavior of images with the longdesc attribute (and likely the aria-describedat attribute), was a very unpopular option, second only to being ignored entirely.
"Skip" Links
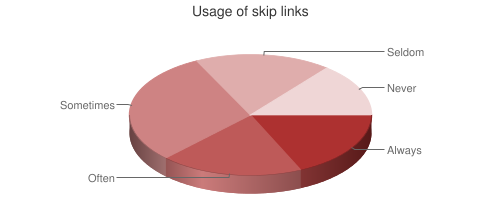
| Response | # of Respondents | % of Respondents |
|---|---|---|
| Whenever they're available | 428 | 18.3% |
| Often | 457 | 19.5% |
| Sometimes | 707 | 30.2% |
| Seldom | 414 | 17.7% |
| Never | 334 | 14.3% |
When compared to previous surveys, there has been a very slight increase in the usage of "skip" links, though usage is very mixed.
Multiple Languages
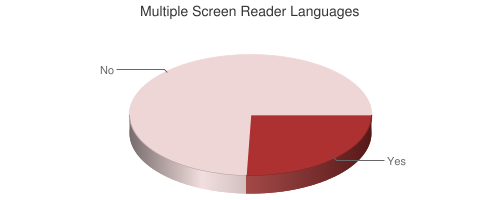
| Response | # of Respondents | % of Respondents |
|---|---|---|
| Yes | 619 | 25.6% |
| No | 1803 | 74.4% |
Not surprisingly, respondents from Asia (73.0%), South America (50.0%), Europe (49.3%), and Africa or Middle East (41.2%) were much more likely to have multi-lingual settings than those from North America (16.5%) or Australia (13.4%). NVDA (40.6%) and VoiceOver (36.4%) users were much more likely to have multi-lingual settings than JAWS (27.6%), Window-Eyes (18.3%), or ZoomText (15.3%) users.
Acrobat/PDF
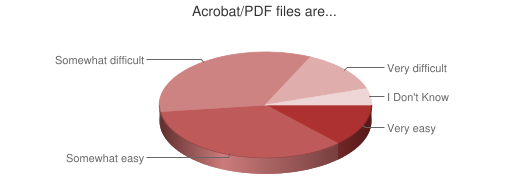
| Response | # of Respondents | % of Respondents |
|---|---|---|
| Very easy | 312 | 12.8% |
| Somewhat easy | 847 | 34.7% |
| Somewhat difficult | 836 | 34.2% |
| Very difficult | 320 | 13.1% |
| I Don't Know | 128 | 5.2% |
While we realize this is not a well worded question, we were interested to see changes since this question was asked on the December 2008 survey. There has not been a significant change in perception - either for better or worse - of PDF ease or difficulty in the last 6.5 years.
Social Media Accessibility
Compared to responses from the May 2012 survey, respondents are a bit more positive about the accessibility of social media sites.