Survey of Users with Motor Disabilities
Introduction
In March 2013, WebAIM conducted a survey of users with motor disabilities. We received 46 valid responses to this survey. This was the first survey WebAIM has conducted of this population, but we hope to conduct additional surveys of this nature again in the future. If you have recommendations or questions you would like us to ask, please contact us.
A few disclaimers and notices:
- The sample size is very small. Because of this and because the responses came from a sample of convenience rather than one that was scientifically controlled, it is highly unlikely that the results represent the broader population of users with motor disabilities. Please do not attempt to generalize these data.
- Totals may not equal 100% due to rounding.
- Total responses (n) for each question may not equal 46 due to respondents not answering that particular question.
Demographics
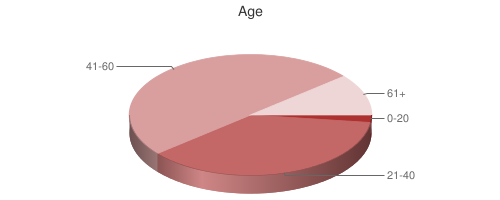
Age
| Response | # of Respondents | % of Respondents |
|---|---|---|
| 0-20 | 2 | 2% |
| 21-40 | 17 | 37% |
| 41-60 | 23 | 50% |
| 61+ | 5 | 11% |
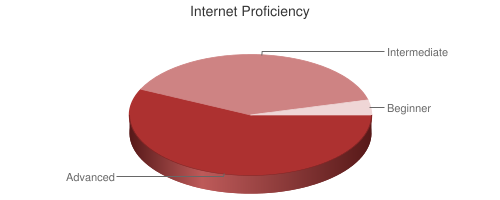
Internet Proficiency
| Response | # of Respondents | % of Respondents |
|---|---|---|
| Advanced | 27 | 63% |
| Intermediate | 14 | 33% |
| Beginner | 2 | 5% |
Respondents indicate a very high level of internet proficiency.
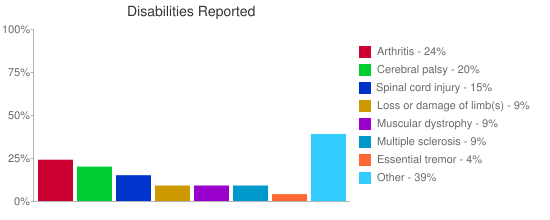
Disabilities Reported
| Disability | # of Respondents | % of Respondents |
|---|---|---|
| Arthritis | 11 | 23.9% |
| Cerebral palsy | 9 | 19.6% |
| Spinal cord injury | 7 | 15.2% |
| Loss or damage of limb(s) | 4 | 8.7% |
| Muscular dystrophy | 4 | 8.7% |
| Multiple sclerosis | 4 | 8.7% |
| Essential tremor | 2 | 4.3% |
| Spina bifida | 0 | 0% |
| ALS (Lou Gehrig's Disease) | 0 | 0% |
| Parkinson's disease | 0 | 0% |
| Other | 18 | 39.1% |
Other disabilities reported include Repetitive Stress Injury (8.7%), Neuropathy (4.3%), etc. 22% of respondents report multiple disabilities.
Because of the limited sample size, these results should not be used as an indication of the prevalence of these disabilities generally or for users of the web.
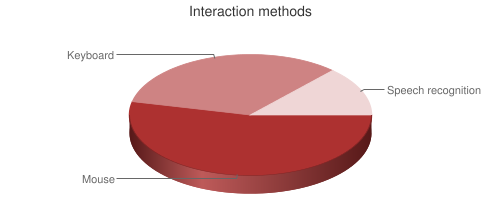
Methods of Interaction with Web Pages
| Response | # of Respondents | % of Respondents |
|---|---|---|
| With a mouse (including trackballs, eye tracking or other devices that behave like a mouse) | 24 | 53.3% |
| With a keyboard (including adaptive keyboards, switches, and other devices that behave like a keyboard) | 15 | 33.3% |
| Using speech recognition | 6 | 13.3% |
Operating System
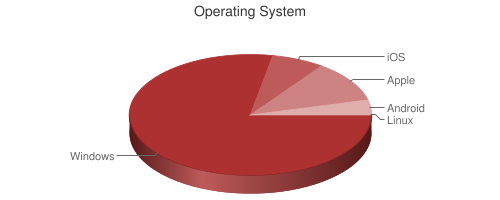
| Response | # of Respondents | % of Respondents |
|---|---|---|
| Windows | 36 | 78.3% |
| iOS | 3 | 6.5% |
| Apple | 5 | 10.9% |
| Android | 2 | 4.3% |
| Linux | 0 | 0% |
Operating system data above was detected from the system used to complete the survey.
OS Settings
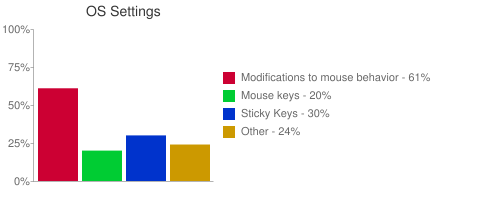
| Setting | # of Respondents | % of Respondents |
|---|---|---|
| Modifications to mouse behavior (e.g., mouse speed, click speed, hover to click, etc.) | 28 | 60.9% |
| "Mouse keys" (numeric keypad to emulate mouse) | 9 | 19.6% |
| "Sticky keys" or filtering repeated keystrokes | 14 | 30.4% |
| Other | 11 | 23.9% |
Technologies Used
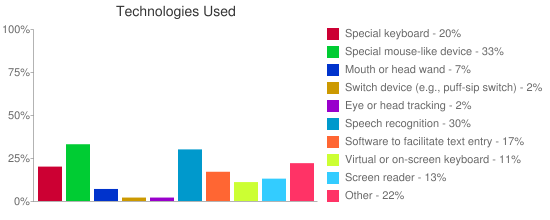
| Technology | # of Respondents | % of Respondents |
|---|---|---|
| Special keyboard | 9 | 19.6% |
| Special mouse-like device (e.g., trackball, touchpad, joystick etc.) that you manipulate with arms/hands or legs/feet | 15 | 32.6% |
| Mouth or head wand | 3 | 6.5% |
| Switch device (e.g., puff-sip switch) | 1 | 2.2% |
| Eye or head tracking | 1 | 2.2% |
| Speech recognition | 14 | 30.4% |
| Software to facilitate text entry (e.g., predictive keyboard) | 8 | 17.4% |
| Virtual or on-screen keyboard | 5 | 10.9% |
| Screen reader | 6 | 13.0% |
| Other | 10 | 21.7% |
A wide variety of devices are used by respondents. 41% of respondents indicate using more than one type of device.
Enlarged Page Content
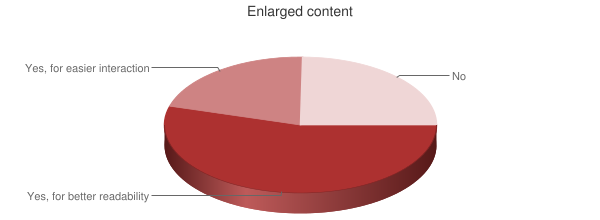
| Response | # of Respondents | % of Respondents |
|---|---|---|
| Yes, to make it easier to read | 24 | 54.5% |
| Yes, to make it easier to interact with the content (e.g., click on a small button) | 9 | 20.5% |
| No | 11 | 25.0% |
It is of interest that so many users enlarge web content, but primarily for readability when readability is not generally impacted by a motor disability.
Primary Browser
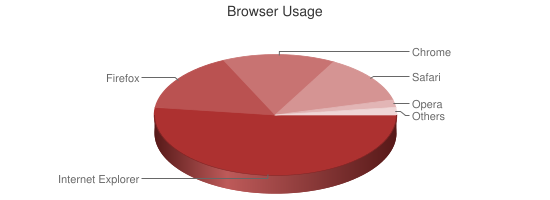
| Browser | # of Respondents | % of Respondents |
|---|---|---|
| Internet Explorer | 13 | 32.6% |
| Firefox | 12 | 26.1% |
| Chrome | 10 | 21.7% |
| Safari | 5 | 10.9% |
| Opera | 3 | 6.5% |
| Others | 1 | 2.2% |
Internet Explorer was the most common browser for keyboard users, Firefox was most common for voice control users, and Chrome was most common for mouse users.
Influence of Browser Accessibility
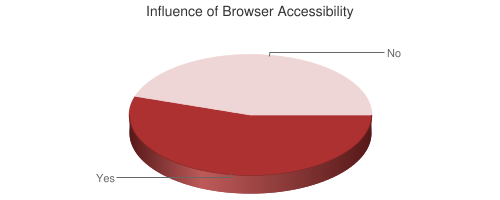
| Response | # of Respondents | % of Respondents |
|---|---|---|
| Yes | 24 | 54.5% |
| No | 20 | 45.5% |
JavaScript Enabled
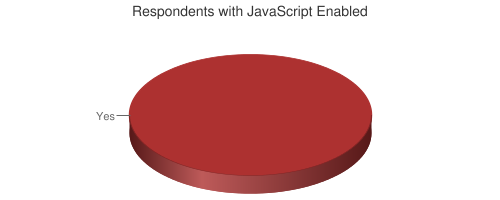
| JavaScript Enabled | # of Respondents | % of Respondents |
|---|---|---|
| Yes | 46 | 100% |
| No | 0 | 0% |
JavaScript support was detected when the survey was submitted. These results clearly indicate that it is important that scripted interfaces be made accessible to users with motor disabilities.
Mobile Device Usage
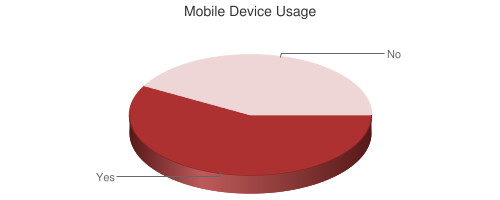
| Response | # of Respondents | % of Respondents |
|---|---|---|
| Yes | 25 | 58.1% |
| No | 18 | 41.9% |
Mobile Platforms
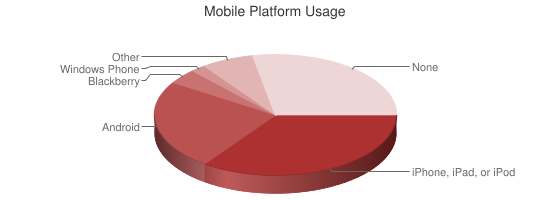
| Mobile Platform | # of Respondents | % of Respondents |
|---|---|---|
| Apple iPad, iPhone, or iPod touch | 16 | 34.8% |
| Android | 11 | 23.9% |
| Blackberry | 2 | 4.3% |
| Windows Phone | 1 | 2.2% |
| Other | 3 | 6.5% |
| None or No Response | 13 | 28.3% |
Mainstream or Disability-specific Mobile Device
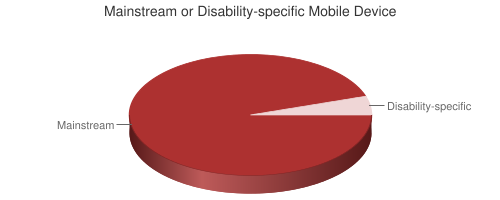
| Response | # of Respondents | % of Respondents |
|---|---|---|
| Yes, it is a device designed for users with disabilities | 2 | 5.6% |
| No, it is a mainstream device | 34 | 94.4% |
Mobile Accessibility Settings
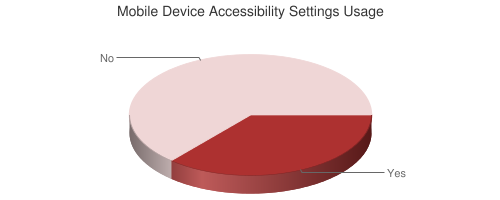
| Response | # of Respondents | % of Respondents |
|---|---|---|
| Yes | 12 | 36.4% |
| No | 21 | 63.6% |
Those who primarily use an iOS device are three times more likely than users of Android to use accessibility settings or software. Use of mobile accessibility settings is notably less than by those with visual disabilities (36% vs 63%).
Use of Mobile Versions
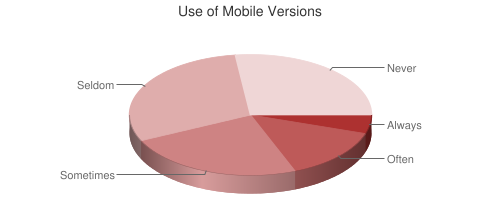
| Response | # of Respondents | % of Respondents |
|---|---|---|
| Always | 2 | 5.4% |
| Often | 5 | 13.5% |
| Sometimes | 9 | 24.3% |
| Seldom | 11 | 29.7% |
| Never | 10 | 27.0% |
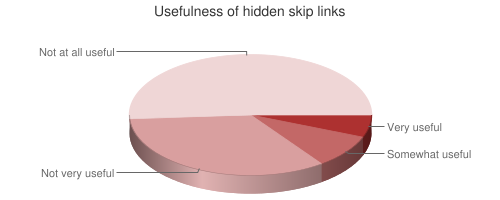
Skip Links
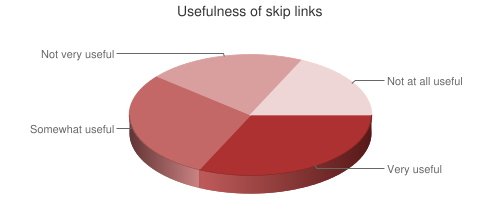
| Response | # of Respondents | % of Respondents |
|---|---|---|
| Very useful | 12 | 31.6% |
| Somewhat useful | 11 | 28.9% |
| Not very useful | 8 | 21.1% |
| Not at all useful | 7 | 18.4% |
Like users with low vision, respondents with motor disabilities generally find skip links to be useful. Keyboard users are much more likely to find skip links useful.
Skip Link Position
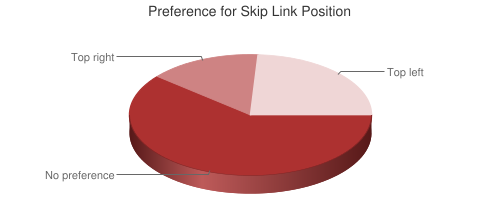
| Response | # of Respondents | % of Respondents |
|---|---|---|
| I have no preference | 28 | 60.9% |
| I prefer the top right | 7 | 15.2% |
| I prefer the top left | 11 | 23.9% |
There is no clear preference for skip link position, though respondents with a preference favor the top left of a page slight more than the top right.
Form Labeling
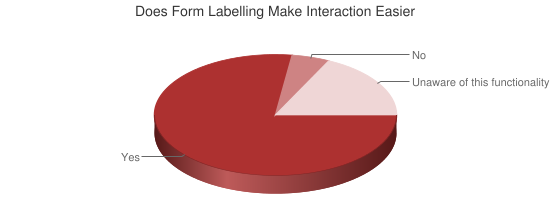
| Response | # of Respondents | % of Respondents |
|---|---|---|
| Yes | 28 | 60.9% |
| No | 4 | 8.7% |
| I was not aware of this functionality | 14 | 30.4% |
Interestingly, 41% of mouse users (for whom this functionality provides the primary benefit) are unaware of this functionality. In other words, those that use a mouse primarily were less likely to know about this mouse-specific functionality than those who primarily use a keyboard or voice control.
Accessibility Techniques
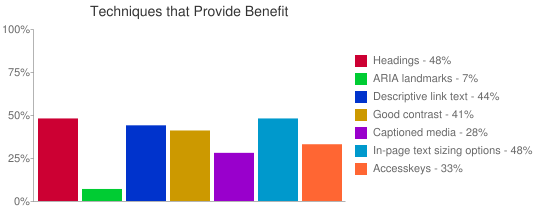
| Technology | # of Respondents | % of Respondents |
|---|---|---|
| Headings | 22 | 47.8% |
| ARIA landmarks | 3 | 6.5% |
| Descriptive link text | 20 | 43.5% |
| Good contrast | 19 | 41.3% |
| Captioned media | 13 | 28.3% |
| Option to increase text size in the webpage | 22 | 47.8% |
| Accesskeys | 15 | 32.6% |
Of note is a very low response to ARIA landmarks, something that would likely provide great benefit to this audience if navigation to them was supported in mainstream browsers.
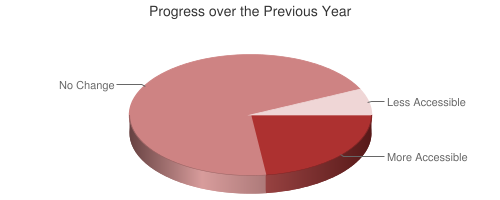
Web Accessibility Progress
| Response | # of Respondents | % of Respondents |
|---|---|---|
| Web content has become more accessible | 10 | 23.3% |
| Web content accessibility has not changed | 30 | 69.7% |
| Web content has become less accessible | 3 | 7.0% |
Conclusion
Like all of our surveys, these results show a very diverse set of respondents, perhaps more so than with other disabilities due to the wider variety of types of disabilities (and thus technologies used) among those with motor disabilities. This highlights that there is not one universal solution to meeting the needs of such varied users. This is the first known survey of this audience focused primarily on web accessibility. While the response set was small, the information may be of interest to you and will be useful as future surveys are constructed.
Social Media Accessibility