Survey of Web Accessibility Practitioners Results
Introduction
In July 2014, WebAIM conducted a survey of web accessibility practitioners. We received 900 valid responses to this survey. A few disclaimers and notices:
- Totals may not equal 100% due to rounding.
- Total responses (n) for each question may not equal 900 due to respondents not answering that particular question.
- The sample was not controlled and may not represent all web accessibility practitioners.
- We hope to conduct additional surveys of this nature again in the future. If you have recommendations or questions you would like us to ask, please contact us.
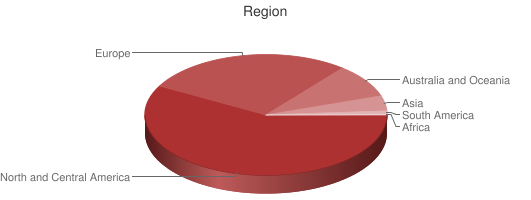
Region
| Response | # of Respondents | % of Respondents |
|---|---|---|
| North and Central America | 520 | 58.0% |
| Europe | 251 | 28.0% |
| Australia and Oceania | 82 | 9.1% |
| Asia | 32 | 3.6% |
| South America | 11 | 1.2% |
| Africa/Middle East | 1 | .1% |
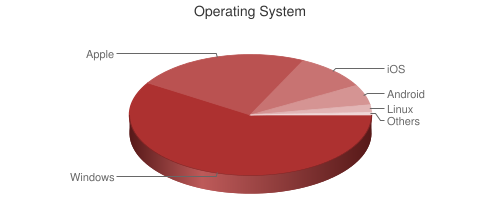
Operating Systems
| Response | # of Respondents | % of Respondents |
|---|---|---|
| Windows | 530 | 58.9% |
| Apple | 210 | 23.3% |
| iOS | 87 | 9.7% |
| Android | 49 | 5.4% |
| Linux | 18 | 2.0% |
| Others | 6 | 0.7% |
Operating system data was detected from the system used to complete the survey.
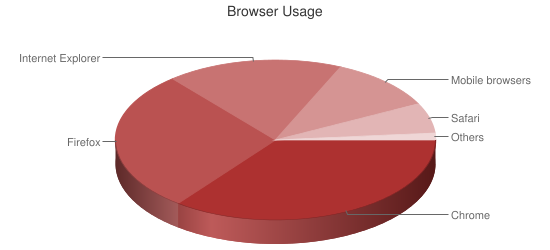
Browsers
| Browser | # of Respondents | % of Respondents |
|---|---|---|
| Chrome | 320 | 35.6% |
| Firefox | 257 | 28.6% |
| Internet Explorer | 161 | 17.9% |
| All Mobile Browsers | 98 | 10.9% |
| Safari | 55 | 6.1% |
| Others | 9 | 1.0% |
Browser data was detected from the system used to complete the survey. Internet Explorer usage (17.9%) is significantly lower than from the January 2014 screen reader user survey (58.7%). IE versions were 33.5% IE11, 15.5% IE10, 29.8% IE9, and 21.1% IE 8 or older.
41.5% of respondents without disabilities use Chrome compared to only 16.6% of those with disabilities. Internet Explorer usage is notably higher for respondents with disabilities and those from government.
JavaScript Enabled
| JavaScript Enabled | % of Respondents |
|---|---|
| Yes | 99.5% |
| No | 0.5% |
As with other WebAIM surveys, nearly all respondents have JavaScript enabled.
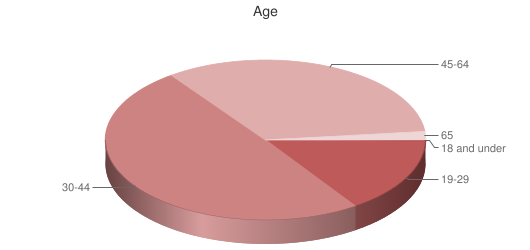
Age
| Response | # of Respondents | % of Respondents |
|---|---|---|
| 18 and under | 3 | 0.3% |
| 19-29 | 135 | 15.2% |
| 30-44 | 441 | 49.5% |
| 45-64 | 297 | 33.3% |
| 65+ | 15 | 1.7% |
When compared to age demographics from surveys conducted in the broader web design and development field, those in web accessibility tend to be notably older. The 2011 A List Apart Survey for People Who Make Websites, for example, had 45.4% of respondents under age 29, compared to only 15.5% for web accessibility practitioners.
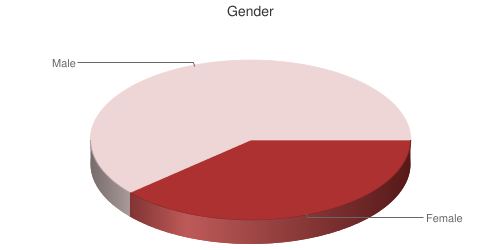
Gender
| Response | # of Respondents | % of Respondents |
|---|---|---|
| Female | 342 | 38.6% |
| Male | 543 | 61.4% |
The prevalence of women in the web accessibility field is over double that reported in the broader web design/development field. Is accessibility's focus on equality more inviting and welcoming to women than other technology fields?
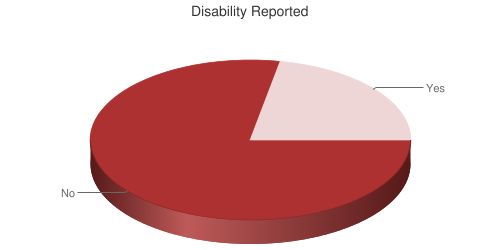
Disability Reported
| Response | # of Respondents | % of Respondents |
|---|---|---|
| No | 691 | 78.2% |
| Yes | 193 | 21.8% |
It is not surprising that the web accessibility field would include a high percentage of users with disabilities. Notable differences in survey responses between respondents with and without disabilities are noted throughout this report.
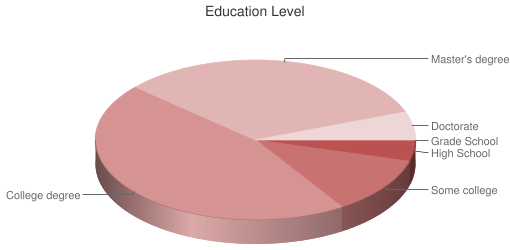
Education Level
| Response | # of Respondents | % of Respondents |
|---|---|---|
| Grade/Primary School | 1 | .1% |
| High/Secondary School | 38 | 4.2% |
| Some College or University | 104 | 11.6% |
| College diploma, associate's, bachelor's, or equivalent degree | 409 | 45.6% |
| Master's degree | 294 | 32.8% |
| Doctorate | 51 | 5.7% |
Compared to others in the design/development field, those in web accessibility are notably more educated. 73.1% of respondents to The A List Apart survey had earned a college, master's, or doctorate degree, compared to 84.1% of web accessibility practitioners.
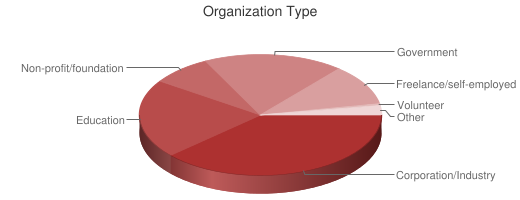
Organization Type
| Response | # of Respondents | % of Respondents |
|---|---|---|
| Corporation or industry | 338 | 38.4% |
| Educational institution | 186 | 21.1% |
| Non-profit or foundation | 71 | 8.1% |
| Governmental entity | 165 | 18.7% |
| Freelancer/Self-employed | 95 | 10.8% |
| Volunteer or volunteer organization | 4 | 0.5% |
| Other | 22 | 2.5% |
43% of male respondents work for a corporation or industry compared to 31.1% of women. Women were more likely to work in education - 27.8% compared to 16.8% of men - and government - 22.2% compared to 16.6% of men.
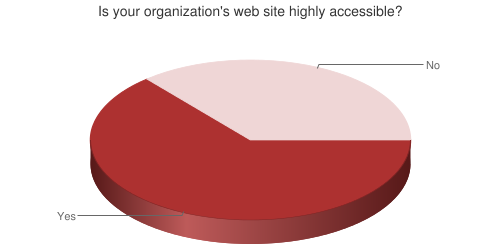
Accessible Organization Web Site
| Response | % of Respondents |
|---|---|
| Yes | 63.8% |
| No | 36.2% |
57% of respondents from both corporations/industry and education thought their web sites were highly accessible compared to 66.2% of those from government, 82.6% of those from non-profits/foundations, and 86.6% of freelancers/self-employed.
Primary Job Title/Role
| Response | # of Respondents | % of Respondents |
|---|---|---|
| Web accessibility expert/consultant/lead | 339 | 38.0% |
| Developer | 199 | 22.3% |
| Project manager or administrator | 75 | 8.4% |
| Usability or information architect | 52 | 5.8% |
| Designer | 47 | 5.3% |
| Content specialist/strategist | 43 | 4.8% |
| Educator | 35 | 3.9% |
| Quality assurance/testing | 34 | 3.8% |
| Student | 8 | 0.9% |
| Marketer | 4 | 0.4% |
| Volunteer | 4 | 0.4% |
| Administrative assistant or secretary | 3 | 0.3% |
| Other | 49 | 5.5% |
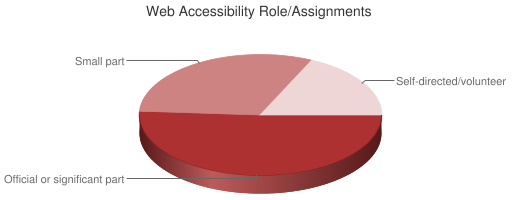
Web Accessibility Role/Assignments
| Response | # of Respondents | % of Respondents |
|---|---|---|
| Official role or significant part of job assignment | 453 | 51.3% |
| A small part of my role or assignments | 274 | 31.0% |
| Self-directed/volunteer | 156 | 17.7% |
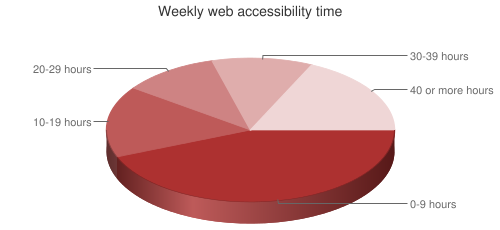
Weekly Web Accessibility Time
| Response | # of Respondents | % of Respondents |
|---|---|---|
| 0-9 hours | 382 | 43.9% |
| 10-19 hours | 139 | 16.0% |
| 20-29 hours | 94 | 10.8% |
| 30-39 hours | 98 | 11.3% |
| 40+ hours | 157 | 18.0% |
The majority of those implementing accessibility do so part-time. While 51.3% indicate that web accessibility is their official role or a significant part of their job assignment, only 29.3% spend more than 30 hours per week in this area.
Web Accessibility Experience
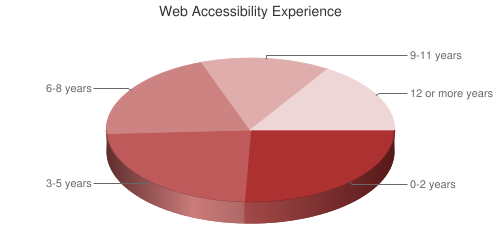
| Response | # of Respondents | % of Respondents |
|---|---|---|
| 0-2 years | 226 | 25.7% |
| 3-5 years | 207 | 23.5% |
| 6-8 years | 179 | 20.3% |
| 9-11 years | 128 | 14.5% |
| 12+ years | 141 | 16.0% |
Salary
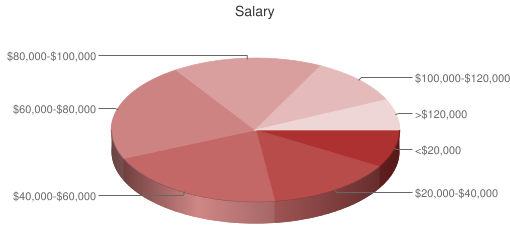
| Response | # of Respondents | % of Respondents |
|---|---|---|
| Less than $20,000 | 66 | 8.5% |
| $20,000-$40,000 | 112 | 14.4% |
| $40,000-$60,000 | 161 | 20.6% |
| $60,000-$80,000 | 173 | 22.2% |
| $80,000-$100,000 | 131 | 16.8% |
| $100,000-$120,000 | 83 | 10.6% |
| More than $120,000 | 54 | 6.9% |
Salaries of web accessibility practitioners are quite diverse with a median salary range of $60,000-$80,000. Respondents have significantly higher salaries than those reported on the ALA salary survey of 2011 for web designers and developers and a 2012 Coders' Survey, and higher average salaries than most design or development roles on this 2014 survey. 56.5% of respondents reported earning over $60,000 compared to only 37.1% of respondents to the 2011 ALA Survey for People Who Make Websites.
As would be expected, those with more education and more experience earn significantly more than their peers. Web accessibility experts/consultants/leads were the best paid with 64.2% earning over $60,000 compared to 55.3% of project managers/administrators, 51.1% of developers, and 39.6% of designers. Those from corporations or industries earned the most - at least $2500 more than those in government, $14,000 more than those in education, and $22,000 more than freelancers/self-employed.
Gender wage gap
Female respondents earn an average of at least $8,200 less than their male counterparts. However, much of this disparity can be attributed to women working predominantly in education and government, which both pay notably less than the corporate sector where men predominantly reported working. When comparing salaries within individual fields, women make slightly more than men in the corporate sector - significantly different than the notable gender pay gap in other corporate technology fields. However, in education women make a minimum of almost $10,000 less than men, almost $14,000 less than men in government, and over $20,000 less than men in the freelancer/self-employed sector. While this survey was not intended to be an exploration into gender wage gaps, we do find this data of interest.
Disability wage gap
A significant disparity also exists for those with disabilities - they earn an average of at least $12,400 less than those without disabilities despite having very similar education level and years of experience. Unlike with gender, the work sectors for those with disabilities were not a factor in this disparity. In fact, people with disabilities were slightly more likely to work in sectors with higher pay than those without disabilities, thus making this disparity in pay even more notable.
While the survey data show that web accessibility is perhaps the most diverse web technology field, notable disparities exist in pay. Of note is that the survey did not ask regarding part-time work, which may account for some of the gender and/or disability wage gap. Also, no known data are available to accurately determine how the pay disparity in the web accessibility field compares to other technology fields.
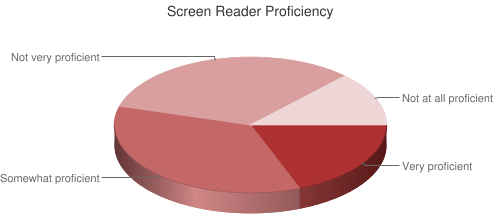
Web Accessibility Proficiency
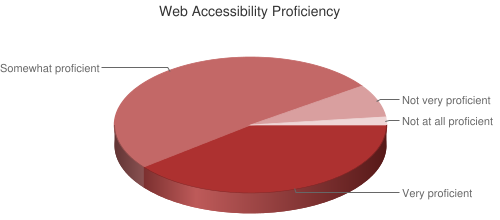
| Response | # of Respondents | % of Respondents |
|---|---|---|
| Very proficient | 350 | 39.4% |
| Somewhat proficient | 452 | 50.9% |
| Not very proficient | 69 | 7.8% |
| Not at all proficient | 17 | 1.9% |
Respondents reported a high level of web accessibility proficiency. As would be expected, those that spend more time in accessibility efforts each week and that have worked in the field longer report high proficiency.
Web Accessibility Progress
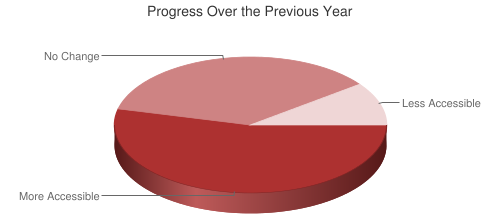
| Response | # of Respondents | % of Respondents |
|---|---|---|
| Web content has become more accessible | 462 | 53.8% |
| Web content accessibility has not changed | 309 | 36% |
| Web content has become less accessible | 88 | 10.2% |
Respondents are generally optimistic about change over time. When compared to other recent WebAIM surveys, more web accessibility practitioners indicated that accessibility has improved (53.8%) than screen reader users (36.7%), users with low vision (28.6%), and users with motor disabilities (23.3%). While these differences are notable, for this survey, web accessibility practitioners with disabilities were only slightly less optimistic (49.7% of respondents with disabilities thought accessibility had improved) than those without disabilities (54.7% saw improvements). In short, those with disabilities that actually implement accessibility are much more positive about progress than other users with disabilities.
Impacts on Accessibility
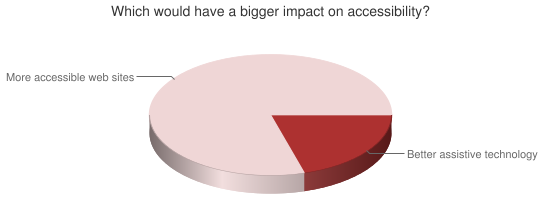
| Response | # of Respondents | % of Respondents |
|---|---|---|
| Better (more accessible) web sites | 706 | 79.5% |
| Better assistive technology | 182 | 20.5% |
These responses are very similar to responses of screen reader users.
Primary Effort
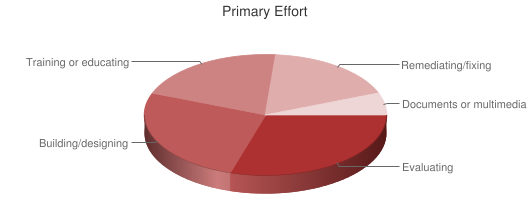
| Response | # of Respondents | % of Respondents |
|---|---|---|
| Evaluating web site accessibility | 260 | 29.7% |
| Building/designing web sites | 229 | 26.1% |
| Training or educating on web accessibility | 180 | 20.5% |
| Remediating/fixing web sites | 155 | 17.7% |
| Document (PDF, Word, etc.) or multimedia accessibility | 52 | 5.9% |
Those with more web accessibility proficiency spend more effort evaluating and training/educating than those with less proficiency. Those with disabilities are twice as likely to primarily evaluate and half as likely to build/design web sites than those without disabilities.
Accessibility Certification
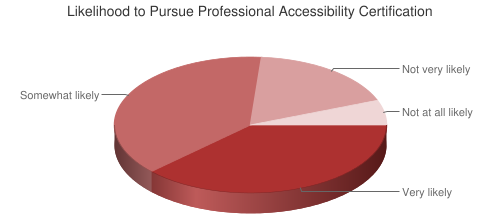
| Response | # of Respondents | % of Respondents |
|---|---|---|
| Very likely | 333 | 38.0% |
| Somewhat likely | 336 | 38.3% |
| Not very likely | 156 | 17.8% |
| Not at all likely | 52 | 5.9% |
The vast majority of respondents indicate a likelihood to pursue professional certification. Those with more web accessibility proficiency are more likely to pursue this, however, 43% of those with 0-5 years of web accessibility experience are very likely to pursue certification compared to 32% of those with 9+ years suggesting that those with more experience find less value in the certification. Those with more education are also less likely to pursue certification.
IAAP Membership
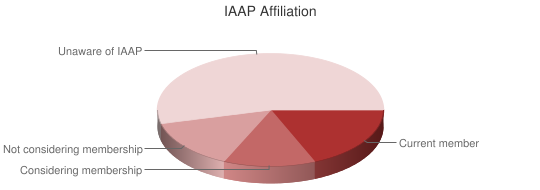
| Response | # of Respondents | % of Respondents |
|---|---|---|
| I am or my organization is a member | 164 | 18.6% |
| Considering membership | 116 | 13.2% |
| Not considering membership | 126 | 14.3% |
| I was not aware of IAAP | 475 | 53.9% |
WCAG Familiarity
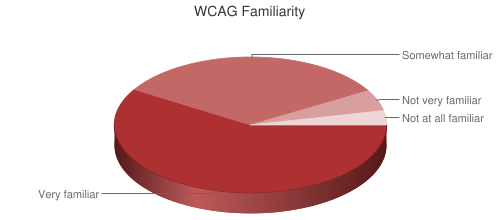
| Response | # of Respondents | % of Respondents |
|---|---|---|
| Very familiar | 522 | 58.8% |
| Somewhat familiar | 292 | 32.9% |
| Not very familiar | 44 | 5.0% |
| Not at all familiar | 30 | 3.4% |
ARIA Familiarity
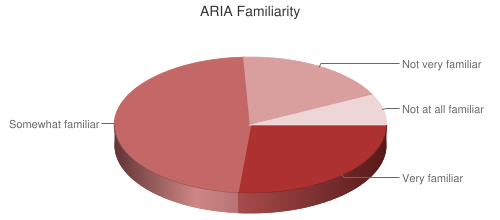
| Response | # of Respondents | % of Respondents |
|---|---|---|
| Very familiar | 236 | 26.5% |
| Somewhat familiar | 426 | 47.8% |
| Not very familiar | 165 | 18.5% |
| Not at all familiar | 65 | 7.3% |
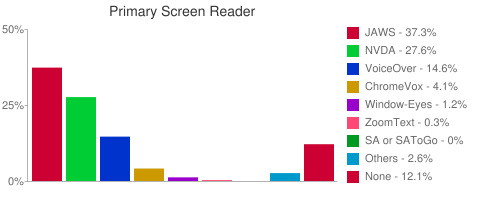
Primary Screen Reader
| Screen Reader | # of Respondents | % of Respondents |
|---|---|---|
| JAWS | 329 | 37.3% |
| NVDA | 243 | 27.6% |
| VoiceOver | 129 | 14.6% |
| ChromeVox | 36 | 4.1% |
| Window-Eyes | 11 | 1.2% |
| ZoomText | 3 | 0.3% |
| System Access or System Access To Go | 0 | 0% |
| Other | 23 | 2.6% |
| I don't use a screen reader | 107 | 12.1% |
There is some disparity between the primary screen reader of those implementing accessibility and those who use screen readers due to a disability. JAWS usage among those with disabilities is significantly higher (57.1%) than those without disabilities (32%) whereas NVDA (24.3% vs 28.3%), VoiceOver (10.6% vs. 15.7%), and ChromeVox (1.1% vs. 5%) usage is lower among those with disabilities.
JAWS usage was more prevalent among those with higher accessibility proficiency. JAWS was also more prevalent in governmental and education entities whereas NVDA and VoiceOver were popular more in corporations/industry and by freelancers. As an example, from governmental entities, only 4.3% reported using VoiceOver compared to 18.5% of respondents from corporations/industry and 22.1% of respondents that are freelancers or self-employed.
Perhaps most surprising is that not a single respondent indicated that System Access or System Access To Go is their primary screen reader whereas 7.7% of respondents to the January 2014 Screen Reader User survey indicated this.
Regional differences are of note. JAWS was the most popular primary screen reader is North and Central America whereas NVDA was the most popular in Europe and Australia/Oceania.
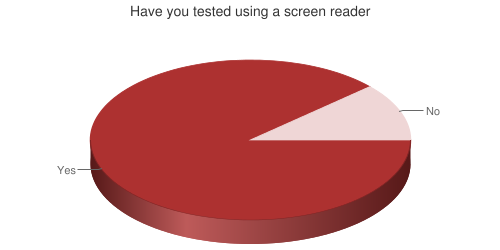
Tested Using a Screen Reader
| Response | # of Respondents | % of Respondents |
|---|---|---|
| Yes | 785 | 88.4% |
| No | 103 | 11.6% |
Screen Reader Proficiency
| Response | # of Respondents | % of Respondents |
|---|---|---|
| Very proficient | 170 | 19.1% |
| Somewhat proficient | 314 | 35.3% |
| Not very proficient | 291 | 32.7% |
| Not at all proficient | 114 | 12.8% |
54.2% of those with disabilities report being very proficient using a screen reader compared to only 9.1% of those without disabilities.
Reasons for Inaccessibility
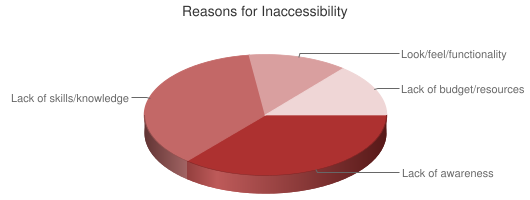
| Response | # of Respondents | % of Respondents |
|---|---|---|
| Lack of awareness of web accessibility | 315 | 36.2% |
| Lack of web accessibility skills or knowledge | 318 | 36.6% |
| Fear that accessibility will hinder the look, feel, or functionality | 115 | 13.2% |
| Lack of budget or resources to make it accessible | 121 | 13.9% |
Many respondents indicated in the survey comments that they desired an "All of the above" option. This question was primarily asked to compare responses to those provided on a screen reader user survey. While a large number of respondents of both surveys chose lack of awareness, practitioners attribute inaccessibility to lack of skills/knowledge and budget/resources more than screen reader users do. Screen reader users were almost twice as likely to indicate that impact on look, feel, or functionality contributes to inaccessibility than practitioners who are more likely to deal with the design and functionality implications of accessibility.
Organizational Factors
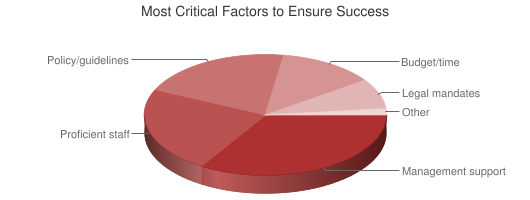
| Response | # of Respondents | % of Respondents |
|---|---|---|
| Management support | 324 | 36.7% |
| Staff that are proficient in accessibility | 219 | 24.8% |
| A clearly defined policy and/or guidelines | 197 | 22.3% |
| Sufficient budget or time support | 77 | 13.9% |
| Legal mandates and requirements | 50 | 8.7% |
| Other | 16 | 1.8% |
Organizational Motivation
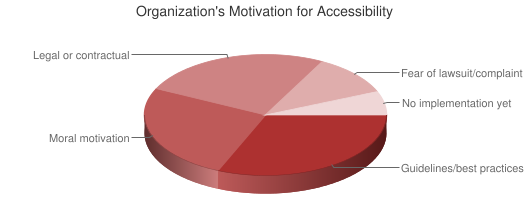
| Response | # of Respondents | % of Respondents |
|---|---|---|
| Compliance with guidelines and/or best practices | 267 | 31.4% |
| Moral motivation (it's the right thing to do) | 219 | 25.7% |
| Legal, contractual, or structured negotiation requirements | 218 | 25.6% |
| Fear of a lawsuit or complaint | 93 | 10.9% |
| My organization does not yet implement accessibility | 54 | 6.3% |
Respondents who indicated that their organization's site is already highly accessible were over 3 times more likely to indicate that morals (it's the right thing to do) were their motivation than those whose web site is not yet accessible. Legal and contractual motivations and fear of lawsuit are higher motivators for those that have not yet achieved accessibility.
There were significant differences in motivations based on organization type. Only 4.4% of respondents in government indicate that their organization is primarily motivated by morals compared to 57.5% of freelancers/self-employed.
Personal Motivation
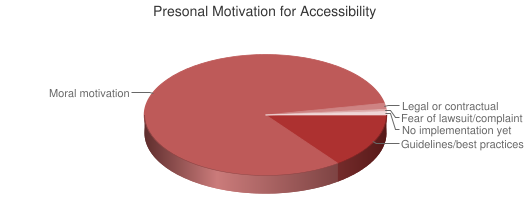
| Response | # of Respondents | % of Respondents |
|---|---|---|
| Compliance with guidelines and/or best practices | 130 | 14.8% |
| Moral motivation (it's the right thing to do) | 720 | 82.1% |
| Legal, contractual, or structured negotiation requirements | 14 | 1.6% |
| Fear of a lawsuit or complaint | 5 | 0.6% |
| I do not yet implement accessibility | 8 | 0.9% |
When compared to the organizational motivations above, this indicates a VERY significant disparity between what motivates web accessibility practitioners and what motivates their organizations. Those with higher web accessibility proficiency are more likely to be motivated by morals than those with lower proficiency (who tended to be motivated more by guidelines and best practices).
This all suggests that intrinsic, moral motivations likely results in better actual accessibility than requirements and fear. See WebAIM’s Hierarchy for Motivating Accessibility Change.
Extra Effort
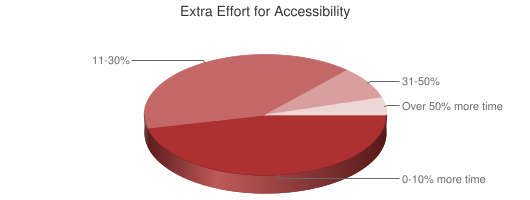
| Response | # of Respondents | % of Respondents |
|---|---|---|
| 0-10% more time | 395 | 46.5% |
| 11-30% | 342 | 40.3% |
| 31-50% | 73 | 8.6% |
| Over 50% more time | 39 | 4.6% |
Many respondents commented that there are many factors that impact additional accessibility effort (such as education level, tools used, etc.). Those with higher web accessibility proficiency and experience indicate that it takes less extra effort than those with lower proficiency and experience. Respondents from industry and government indicated that more effort is required than freelancers and respondents from education. Respondents with sites that are already accessible also indicated that less effort is required than those with sites not yet accessible.