Screen Reader User Survey #7 Results
Introduction
In October 2017, WebAIM surveyed preferences of screen reader users. We received 1792 valid responses. This was a follow-up to 6 previous surveys that were conducted between January 2009 and July 2015 (see Related Resources).
A few disclaimers and notices:
- Totals may not equal 100% due to rounding.
- Total responses (n) for each question may not equal 1792 due to respondents not answering that particular question.
- The sample was not controlled and may not represent all screen reader users.
- We hope to conduct additional surveys of this nature again in the future. If you have recommendations or questions you would like us to ask, please contact us.
Demographics
Region
| Region | # of Respondents | % of Respondents |
|---|---|---|
| North America | 991 | 60.0% |
| Europe/UK | 380 | 23.0% |
| Asia | 141 | 8.5% |
| Australia and Oceania | 61 | 3.7% |
| Africa/Middle East | 39 | 2.4% |
| South America | 35 | 2.1% |
| Central America and Caribbean | 5 | 0.3% |
This survey had more respondents outside North America than previous surveys, thus providing better representation of the global screen reader user audience.
Disability Reported
| Response | # of Respondents | % of Respondents |
|---|---|---|
| Yes | 1,585 | 89.2% |
| No | 192 | 10.9% |
In general, we've found survey responses to be very similar between respondents with and without disabilities. Any notable differences are detailed below to help us determine differences in practices or perceptions between the disability and the developer communities.
Disability Types
| Response | # of Respondents | % of Respondents |
|---|---|---|
| Blindness | 1,358 | 75.8% |
| Low Vision/Visually-Impaired | 366 | 20.4% |
| Cognitive | 39 | 2.2% |
| Deafness/Hard-of-Hearing | 90 | 5.0% |
| Motor | 33 | 1.8% |
| Other | 41 | 2.3% |
239 respondents (13.3%) reported multiple disabilities. 70 respondents (3.9%) reported being both deaf and blind.
The number of respondents with low vision was notably lower than in 2015. This corresponds with decreased usage of ZoomText among respondents.
Screen Reader Proficiency
| Response | # of Respondents | % of Respondents |
|---|---|---|
| Advanced | 1,039 | 59.5% |
| Intermediate | 604 | 34.6% |
| Beginner | 104 | 6.0% |
Those who use screen readers due to a disability report themselves as more proficient with screen readers—64.2% of those with disabilities considered their proficiency to be "Advanced" compared to only 19.8% of those without disabilities.
Internet Proficiency
| Response | # of Respondents | % of Respondents |
|---|---|---|
| Advanced | 1,278 | 72.9% |
| Intermediate | 444 | 25.3% |
| Beginner | 30 | 1.7% |
Reported proficiency on this survey was notably higher than all previous surveys, perhaps suggesting that screen reader users are becoming more accustomed to using the internet. Those without disabilities rate themselves as more proficient than those with disabilities.
Screen Reader Usage
| Response | # of Respondents | % of Respondents |
|---|---|---|
| I exclusively rely on screen reader audio | 1,311 | 75.6% |
| I primarily rely on screen reader audio, but also use visual content | 193 | 11.1% |
| I primarily rely on visual content, but also use screen reader audio | 145 | 8.4% |
| I exclusively rely on visual content | 85 | 4.9% |
Nearly 25% of respondents rely at least partially on the visual components when using a screen reader. 83.4% of those with disabilities rely exclusively on audio, compared to only 5.3% of those without disabilities (primarily testers). This is not entirely unexpected, but does indicate significant differences in usage between those with disabilities and those without disabilities.
Only 1.3% of those with disabilities rely exclusively on the visual output—many of these reported having cognitive or learning disabilities. Users of ZoomText, Narrator, and ChromeVox were much more likely to use the visual output than users of other screen readers.
Primary Screen Reader
| Screen Reader | # of Respondents | % of Respondents |
|---|---|---|
| JAWS | 811 | 46.6% |
| NVDA | 555 | 31.9% |
| VoiceOver | 204 | 11.7% |
| ZoomText | 42 | 2.4% |
| System Access or SA To Go | 30 | 1.7% |
| Window-Eyes | 27 | 1.5% |
| ChromeVox | 7 | 0.4% |
| Narrator | 6 | 0.3% |
| Other | 60 | 3.4% |
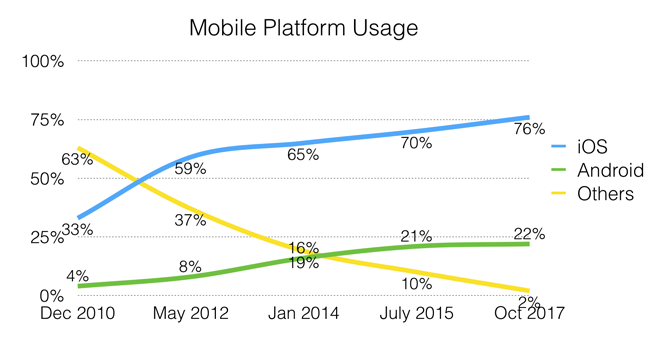
The following chart shows historical trends for primary screen reader usage.
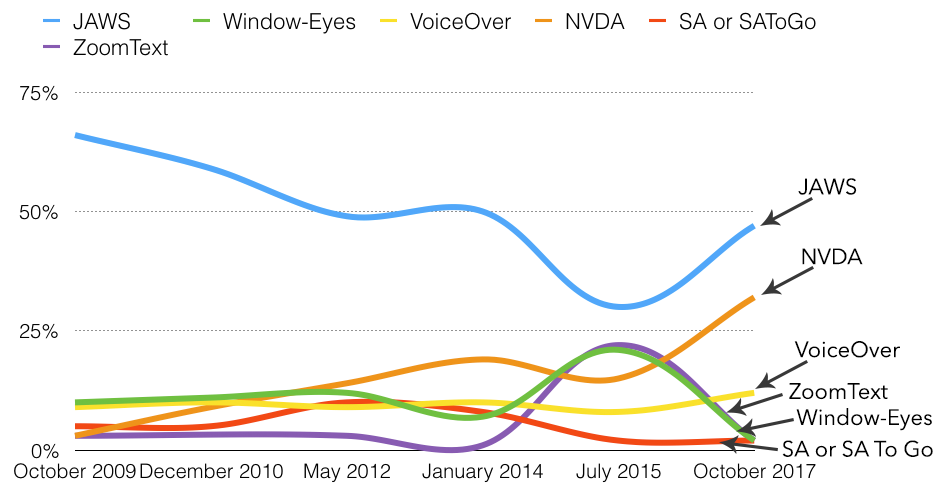
What happened in 2015? Essentially, the survey was distributed to a much broader audience, with many ZoomText and Window-Eyes users recruited to respond. Window-Eyes was also offered freely with Microsoft Office before the 2015 survey, but has since been discontinued. A much broader analysis from 2015 is available on the WebAIM blog.
This doesn't necessarily mean that the 2015 numbers were inaccurate. They certainly are accurate of respondents for that survey, which included more low-vision users than any other survey. 39% of respondents in July 2015 reported low vision, compared to only 20.4% on this survey. This difference in respondent demographics accounts for much or most of the decrease of respondents using ZoomText in 2017.
In short, there are three primary players—JAWS, NVDA, and VoiceOver. But we should not discount the continued impact of other screen readers, primarily ZoomText among the broader low vision community.
For survey simplicity, other specific screen readers were not offered as response options. The survey comments indicate that SuperNova was very common among "Other" screen readers.
Respondents with disabilities are more likely to use JAWS and less likely to use VoiceOver as their primary screen reader than respondents without disabilities. 10.4% of respondents with disabilities use VoiceOver compared to 22.6% of respondents without disabilities.
NVDA users reported higher levels of screen reader proficiency than users of other screen readers.
Screen Readers Commonly Used
| Screen Reader | % of Respondents |
|---|---|
| JAWS | 66.0% |
| NVDA | 64.9% |
| VoiceOver | 39.6% |
| ZoomText | 6.0% |
| SA or SA To Go | 4.0% |
| Window-Eyes | 4.7% |
| Narrator | 21.4% |
| ChromeVox | 5.1% |
| Other | 6.4% |
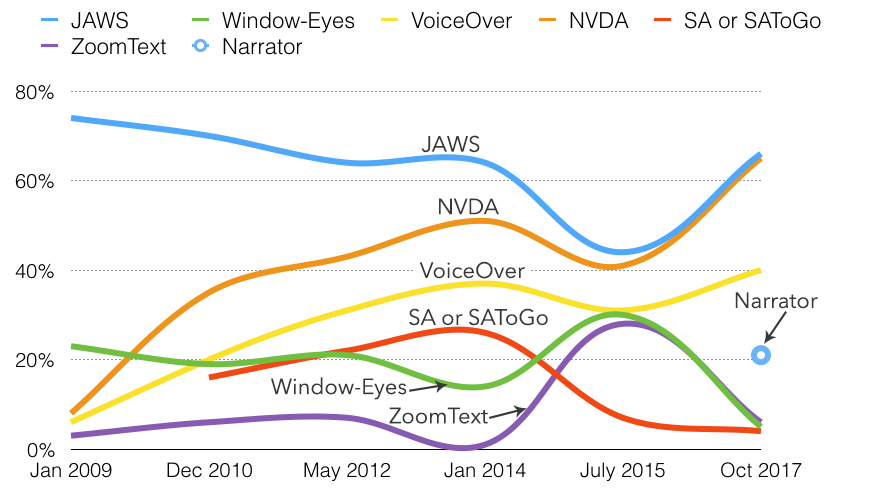
See the commentary above regarding the July 2015 values.
Usage of JAWS, NVDA, and VoiceOver are all up since 2015, with Window-Eyes and ZoomText significantly lower. Of note is that Narrator, which has been significantly improved in Windows 10, was used as a primary screen reader by only 0.3% of respondents, but was commonly used by 21.4% of respondents.
68% of respondents use more than one desktop/laptop screen reader. This was up from 53% in July 2015. 36% use three or more, and 12% use four or more different screen readers. VoiceOver users most commonly use additional screen readers, which is notable since the other screen readers run almost exclusively on Windows.
Free/Low-cost Screen Readers
| Response | # of Respondents | % of Respondents |
|---|---|---|
| Yes | 1,367 | 77.8% |
| No | 184 | 10.5% |
| I Don't Know | 206 | 11.7% |
The positive perception of free or low-cost screen readers continues to increase. Positive responses to this question were 48% in October 2009, 60% in December 2010, 67% in May 2012, 74% in January 2014, and 78% now.
Only 66% of JAWS users answered "Yes" compared to an overwhelming 92% of VoiceOver users and 94% of NVDA users. Those that actually use free or low-cost screen readers have a much better perception of them than those who do not use them. Respondents with "Advanced" screen reader proficiency were also more favorable of free/low-cost screen readers.
Screen Reader Updates
| Response | # of Respondents | % of Respondents |
|---|---|---|
| Yes | 1,562 | 88.5% |
| No | 203 | 11.5% |
The vast majority (88.5%) of respondents indicated that their screen reader has been updated in the last year. This was 82.7% in 2014. 95.5% of NVDA users, 93.4% of VoiceOver users, and 85.9% of JAWS users updated in the last year.
Browsers
| Browser | # of Respondents | % of Respondents |
|---|---|---|
| Firefox | 719 | 41.0% |
| Internet Explorer 11 | 408 | 23.3% |
| Chrome | 271 | 15.5% |
| Safari | 184 | 10.5% |
| Internet Explorer 6, 7, or 8 | 71 | 4.1% |
| Internet Explorer 9 or 10 | 70 | 4.0% |
| Microsoft Edge | 8 | 0.5% |
| Other | 22 | 1.3% |
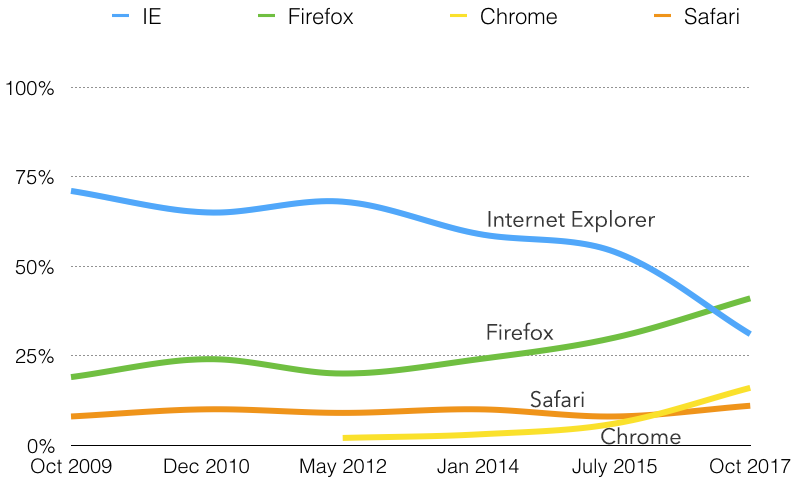
For the first time, IE is no longer the most common browser among respondents. Internet Explorer (all versions) usage decreased to 31.4% from 53.5% in July 2015, 58.7% in January 2014, and 67.5% in May 2012. Firefox was used by 41% (up from 24.2% in 2014) of respondents. 31.4% represents a significantly higher IE usage than among the overall population (most statistics place it well below 10%). Usage of IE 6 through 10 was almost non-existent (1.6%) among those without disabilities, but remains at 8.8% among those with disabilities.
Usage of Internet Explorer was much higher in North America than elsewhere in the world. 35% of respondents from North America reported using IE as their primary browser, compared to only 23.4% in Asia and 24% in Europe.
Usage of Chrome more than doubled since July 2015, but was still well below usage by the overall population. Microsoft Edge usage was very low at .5%—notably below the overall population.
Screen Reader / Browser Combinations
| Screen Reader & Browser | # of Respondents | % of Respondents |
|---|---|---|
| JAWS with Internet Explorer | 424 | 24.7% |
| NVDA with Firefox | 405 | 23.6% |
| JAWS with Firefox | 260 | 15.1% |
| VoiceOver with Safari | 172 | 10.0% |
| JAWS with Chrome | 112 | 6.5% |
| NVDA with Chrome | 102 | 5.9% |
| NVDA with IE | 40 | 2.3% |
| VoiceOver with Chrome | 24 | 1.4% |
| Other combinations | 180 | 10.5% |
There are many combinations in use, with JAWS with IE the most common, followed closely by NVDA with Firefox.
Operating System
| Operating System | # of Respondents | % of Respondents |
|---|---|---|
| Windows | 1,304 | 72.8% |
| iOS | 254 | 14.2% |
| Apple | 141 | 7.9% |
| Android | 55 | 3.1% |
| Linux | 25 | 1.4% |
| Other | 13 | .7% |
Operating system data above was detected from the system used to complete the survey. Respondents using iOS and Android nearly tripled since 2015. Respondents without disabilities were almost 4 times more likely to use Apple than respondents with disabilities, whereas users with disabilities were more likely to respond using iOS devices.
Braille Output
| Response | # of Respondents | % of Respondents |
|---|---|---|
| Yes | 516 | 33.3% |
| No | 1,034 | 66.7% |
Because it would not generally be expected that users without disabilities would use Braille, they have been omitted from these data. Braille usage at 33.3% was up slightly from 27.7% in May 2012. 48.7% of VoiceOver users used Braille compared to a much lower 35.1% of JAWS users and 29.9% of NVDA users.
Mobile Screen Readers
Mobile Screen Reader Usage
| Response | # of Respondents | % of Respondents |
|---|---|---|
| Yes | 1,557 | 88.0% |
| No | 213 | 12.0% |
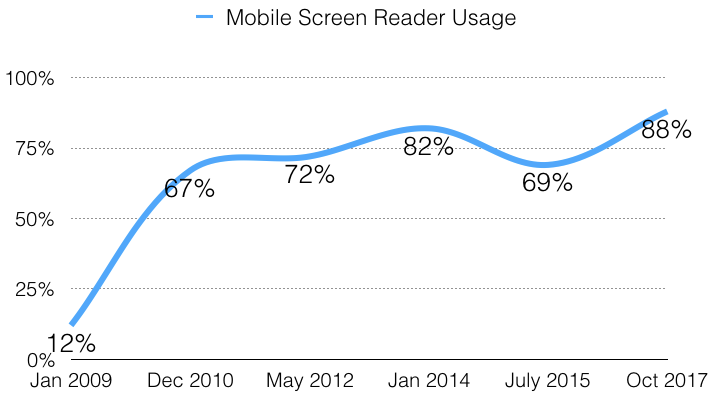
The percentage of respondents using a mobile screen reader was notably up from 69.2% in July 2015, when the survey had broader distribution to a more diverse and less technically proficient user base. 90.9% of respondents with disabilities indicate using a mobile screen reader, compared to only 65.3% of respondents without disabilities. 94.3% of users with advanced screen reader proficiency indicate using a mobile screen reader compared to just 50.5% of those with beginner proficiency.
Mobile Platforms
| Response | # of Respondents | % of Respondents |
|---|---|---|
| Apple iPhone, iPad, or iPod touch | 1,146 | 75.6% |
| Android | 334 | 22.0% |
| Other | 35 | 2.3% |
iOS devices continue to dominate the mobile screen reader market. Android usage increased slightly, though at a slower pace than previous years. Usage of other platforms (Windows Phone, Chrome OS, Nokia, etc.) combined represent only 2.3% of usage.
Usage of iOS devices was significantly higher in North America (85.7%) and Australia (81.4%) than in South America (37.5%), Asia (38.5%), Africa/Middle East (62.5%), and Europe/UK (66.9%).
iOS device usage among screen reader users was notably higher than for the standard population, whereas Android usage was much, much lower. Those with more advanced screen reader and internet proficiency were much more likely to use iOS over Android.
Mobile Screen Readers Used
| Mobile Screen Reader | % of Respondents |
|---|---|
| VoiceOver | 69.0% |
| TalkBack for Android | 29.5% |
| Voice Assistant | 5.2% |
| Mobile Accessibility for Android | 1.9% |
| Nuance Talks | 1.8% |
| MobileSpeak | 1.5% |
| Other | 3.2% |
Since July 2015, VoiceOver usage increased to 69% from 56.7%. TalkBack increased to 29.5% from 17.8% over the same 2.5 year period. All other mobile screen readers saw decreased usage over that period. 20.9% of respondents commonly use multiple mobile screen readers.
Mobile vs. Desktop/Laptop Usage
| Response | # of Respondents | % of Respondents |
|---|---|---|
| Desktop/Laptop | 528 | 34.6% |
| I use mobile/tablet and desktop/laptop screen readers about the same | 825 | 54.0% |
| Mobile/Tablet device | 174 | 11.4% |
54% of respondents use both devices about the same amount. Users are more likely to predominantly use desktop/laptop screen readers than they are mobile/tablet screen readers. Respondents with disabilities are more likely to use a mobile screen reader than respondents without disabilities.
Mobile App vs Web Site Usage
| Response | # of Respondents | % of Respondents |
|---|---|---|
| Mobile App | 779 | 46% |
| Web site | 916 | 54% |
Respondents with disabilities are more likely to use the mobile app than respondents that do not have disabilities. Those with advanced screen reader proficiency were much more likely to use the mobile app than those with beginner proficiency.
Mobile Keyboard Usage
| Response | # of Respondents | % of Respondents |
|---|---|---|
| Always | 39 | 2.6% |
| Often | 181 | 12.0% |
| Sometimes | 394 | 26.2% |
| Seldom | 320 | 21.2% |
| Never | 577 | 38.2% |
Mobile devices are often considered to be touch-only interfaces, yet many screen reader users use a keyboard when using their mobile devices.
Web Accessibility Progress
| Response | # of Respondents | % of Respondents |
|---|---|---|
| Web content has become more accessible | 711 | 40.8% |
| Web content accessibility has not changed | 703 | 40.4% |
| Web content has become less accessible | 327 | 18.8% |
Respondents have a slightly more positive perception of the state of web accessibility now than they did in 2015. Respondents without disabilities tend to be more positive about recent progress (51.7% thought it has become more accessible) than those with disabilities (39.6% thought it has become more accessible).
Impacts on Accessibility
| Response | # of Respondents | % of Respondents |
|---|---|---|
| Better (more accessible) web sites | 1490 | 85.3% |
| Better assistive technology | 257 | 14.7% |
Over time, more respondents have answered "better web sites" to this question—68.6% of respondents in October 2009, 75.8% in December 2010, 81.3% in January 2014, and now 85.3% on this survey. This change perhaps reflects improvements to assistive technology. It certainly indicates that users expect site authors to address accessibility issues.
Landmarks/Regions
| Response | # of Respondents | % of Respondents |
|---|---|---|
| Whenever they're available | 307 | 18.0% |
| Often | 213 | 12.5% |
| Sometimes | 491 | 28.8% |
| Seldom | 364 | 21.3% |
| Never | 332 | 19.4% |
The frequent use of landmarks and regions has continually decreased from 43.8% in January 2014, to 38.6% in July 2015, to 30.5% on this survey. It's difficult to know the reasons for this. It could be due to infrequent or improper usage of landmarks/regions in pages. Or perhaps because other mechanisms are continually better. 45.4% of JAWS users reported always or often using landmarks in July 2015 compared to only 28.5% now just 2.5 years later.
Finding Information
| Response | # of Respondents | % of Respondents |
|---|---|---|
| Navigate through the headings on the page | 1180 | 67.5% |
| Use the "Find" feature | 252 | 14.4% |
| Navigate through the links of the page | 118 | 6.8% |
| Navigate through the landmarks/regions of the page | 69 | 3.9% |
| Read through the page | 128 | 7.3% |
While reliance on headings as the predominant mechanism for finding page information had notably increased between 2008 and 2014, responses to this question are largely unchanged since 2014. While 30.5% of respondents indicate that they always or often use landmarks when they are present, only 3.9% use this method for finding information on a lengthy web page. Those with advanced screen reader proficiency are much more likely to use headings (73% use headings) than those with beginner proficiency (42% use headings) who are more likely to read through the page.
Heading Structures
| Response | # of Respondents | % of Respondents |
|---|---|---|
| One first level heading that contains the site name | 95 | 6.6% |
| One first level heading that contains the document title | 858 | 60.0% |
| Two first level headings, one for the site name and one for the document title | 476 | 33.3% |
Preference for a single <h1> that presents the document title has significantly increased from 37.1% in 2010 to 60% in 2017. A single <h1> for the site name was by far the least desired.
"Skip" Links
| Response | # of Respondents | % of Respondents |
|---|---|---|
| Whenever they're available | 273 | 15.8% |
| Often | 283 | 16.4% |
| Sometimes | 480 | 27.8% |
| Seldom | 374 | 21.6% |
| Never | 319 | 18.4% |
When compared to July 2015, the frequent usage of "skip" links has decreased from 37.8% to 30.2%. 54.9% of respondents without disabilities always or often use "skip" links compared to only 29.6% of respondents with disabilities. This represents a very significant disparity in usage.
It is important to note that while usage has decreased among screen reader users, "skip" links still provide notable benefit for other keyboard users.
Problematic Items
The survey asked respondents to select their most, second most, and third most problematic items from a list. In giving each selected item a weighting, the following chart shows the overall rating of difficulty and frustration for each item.
In order, the most problematic items are:
- CAPTCHA - images presenting text used to verify that you are a human user
- Screens or parts of screens that change unexpectedly
- Links or buttons that do not make sense
- The presence of inaccessible Flash content
- Lack of keyboard accessibility
- Complex or difficult forms
- Images with missing or improper descriptions (alt text)
- Missing or improper headings
- Too many links or navigation items
- Complex data tables
- Inaccessible or missing search functionality
- Lack of "skip to main content" or "skip navigation" links
CAPTCHA remains the most (by a notable margin) problematic item indicated by respondents. The order and indicated difficulty for the items in this list are largely unchanged over the last 8 years, with one notable exception—"Screens or parts of screens that change unexpectedly". This item has moved from 7th most problematic in 2009 to 5th most problematic in 2012 to 2nd most problematic in 2017. This is likely a result of more complex and dynamic web applications.
Respondents with disabilities were nearly twice as likely to rank CAPTCHA and unexpected screen changes as problematic items than respondents without disabilities, who generally indicated that keyboard and forms accessibility were much more problematic than their peers with disabilities. 10.9% of respondents with disabilities rated keyboard accessibility as their single most problematic item, compared to 39.6% of respondents without disabilities. This suggests some notable disparities in perception of difficulties between these two groups.
Social Media Accessibility
Compared to responses from previous surveys, respondents are increasingly positive about the accessibility of social media sites - 69.2% find them very or somewhat accessible compared to 55.2% in 2012 and 60.3% in 2015. 73.1% of respondents with advanced screen reader proficiency rate social media sites as very or somewhat accessible, compared to only 62.8% of respondents with beginner proficiency.