The WebAIM Million
The 2022 report on the accessibility of the top 1,000,000 home pages
Introduction
For the fourth consecutive year, WebAIM conducted an accessibility evaluation of the home pages for the top 1,000,000 web sites. The evaluation was conducted using the WAVE stand-alone API (with additional tools to collect site technology and sector parameters). The results provide an overview of and insight into the current state of web accessibility for individuals with disabilities and trends over time.
The most recent WebAIM Analysis report is now available. Results below are from February 2022—with comparisons to, and trends from, earlier analyses in 2019, 2020, and 2021.
The Sample
Site Lookup
How did your home page rank in our study? Enter a web site domain below (minus "www.") to view details.
The million home page list combines the top home pages and domains from the Majestic Millions list, the Alexa Top 1,000,000 web sites, and the DomCop top 10 million domains.
Sites without home pages, pages that returned errors (404, etc.), or pages with fewer than 10 HTML elements were not included.
Method
The WAVE accessibility engine was used to analyze the rendered DOM of all pages after scripting and styles are applied. WAVE detects end-user accessibility barriers and Web Content Accessibility Guidelines (WCAG) conformance failures. All automated tools, including WAVE, have limitations—not all conformance failures can be automatically detected. Absence of detected errors does not indicate that a site is accessible or compliant. Although based on a subset of accessibility issues, this report provides a quantified and reliable representation of the current state of the inaccessibility of the most influential pages on the web.
Detected Errors
Across the one million home pages, 50,829,406 distinct accessibility errors were detected—an average of 50.8 errors per page. The number of detected errors decreased by 1.1% since the February 2021 (51.4 errors/page) analysis. "Errors" are WAVE-detected accessibility barriers having notable end user impact, and which have a very high likelihood of being WCAG 2 Level A/AA conformance failures.
Home Page Complexity
Home page complexity increased significantly in 12 months, from an average of 887 elements in February 2021 to 955 elements per home page in February 2022 - a 7.7% increase.
The following chart shows the number of home page elements detected over the last four WebAIM Million studies:
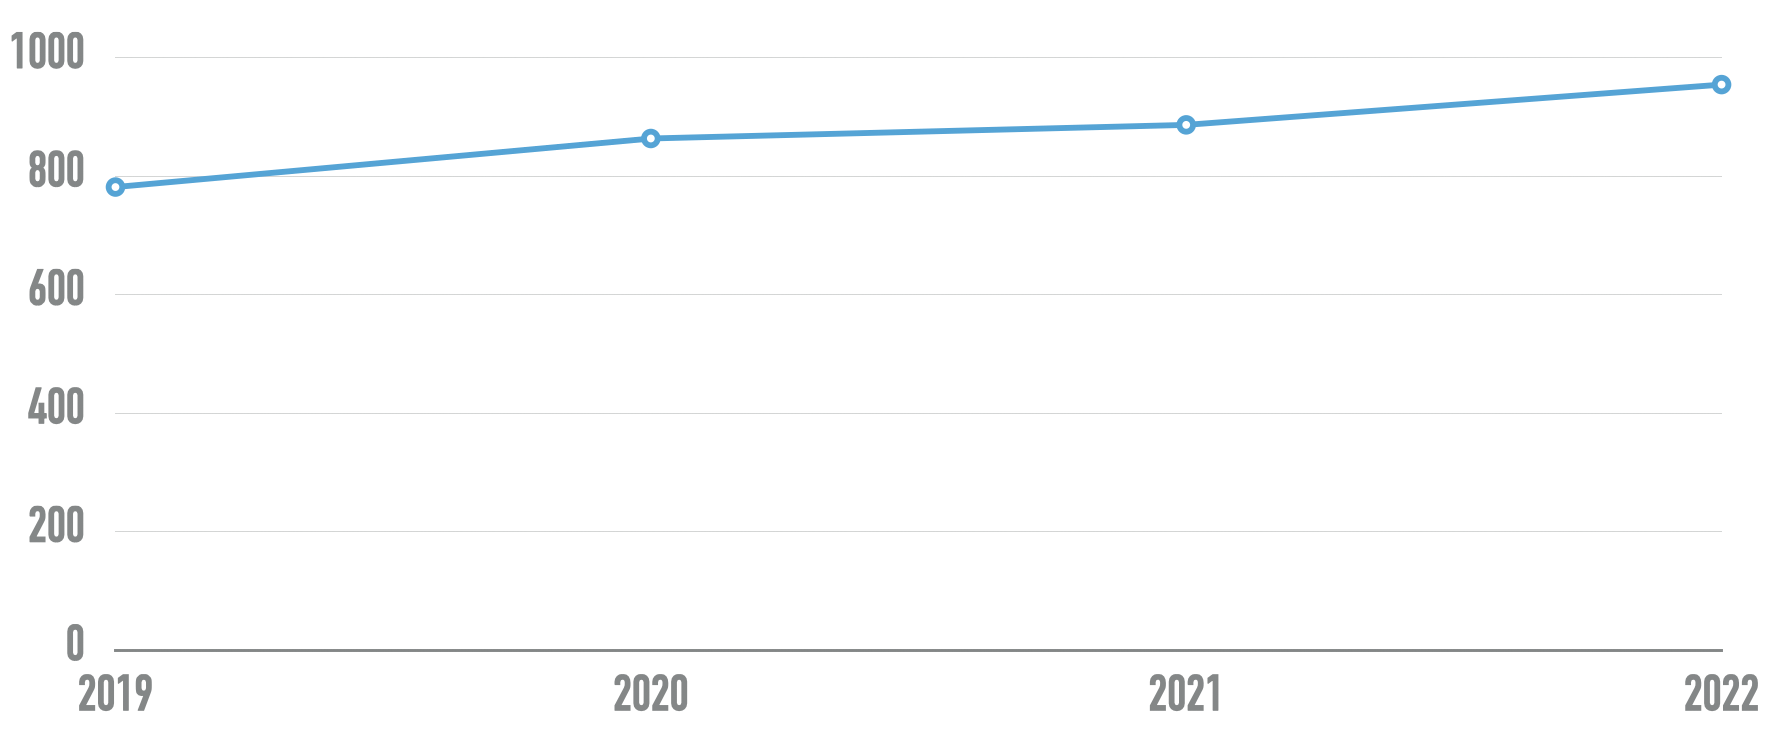
Home page elements have increased over 22% in the last 3 years. It is promising that detected errors have decreased slightly while page complexity has increased notably, but it seems that accessibility progress could be greatly accelerated if home pages were not growing at such alarming rates.
Error Density
5.3% of all home page elements had a detected accessibility error. Users with disabilities would expect to encounter errors on 1 in every 19 home page elements with which they engage.
Error density (number of errors divided by number of page elements) is provided in the site lookup, but is an unreliable metric of site accessibility. A significant number of page elements (<div> and <span> elements, for example) may result in a lower error density (suggesting better accessibility), when in fact many new accessibility errors may have also been introduced. This report focuses on average number of detected errors—likely end user barriers—present as opposed to error densities (how diluted those errors are within page elements).
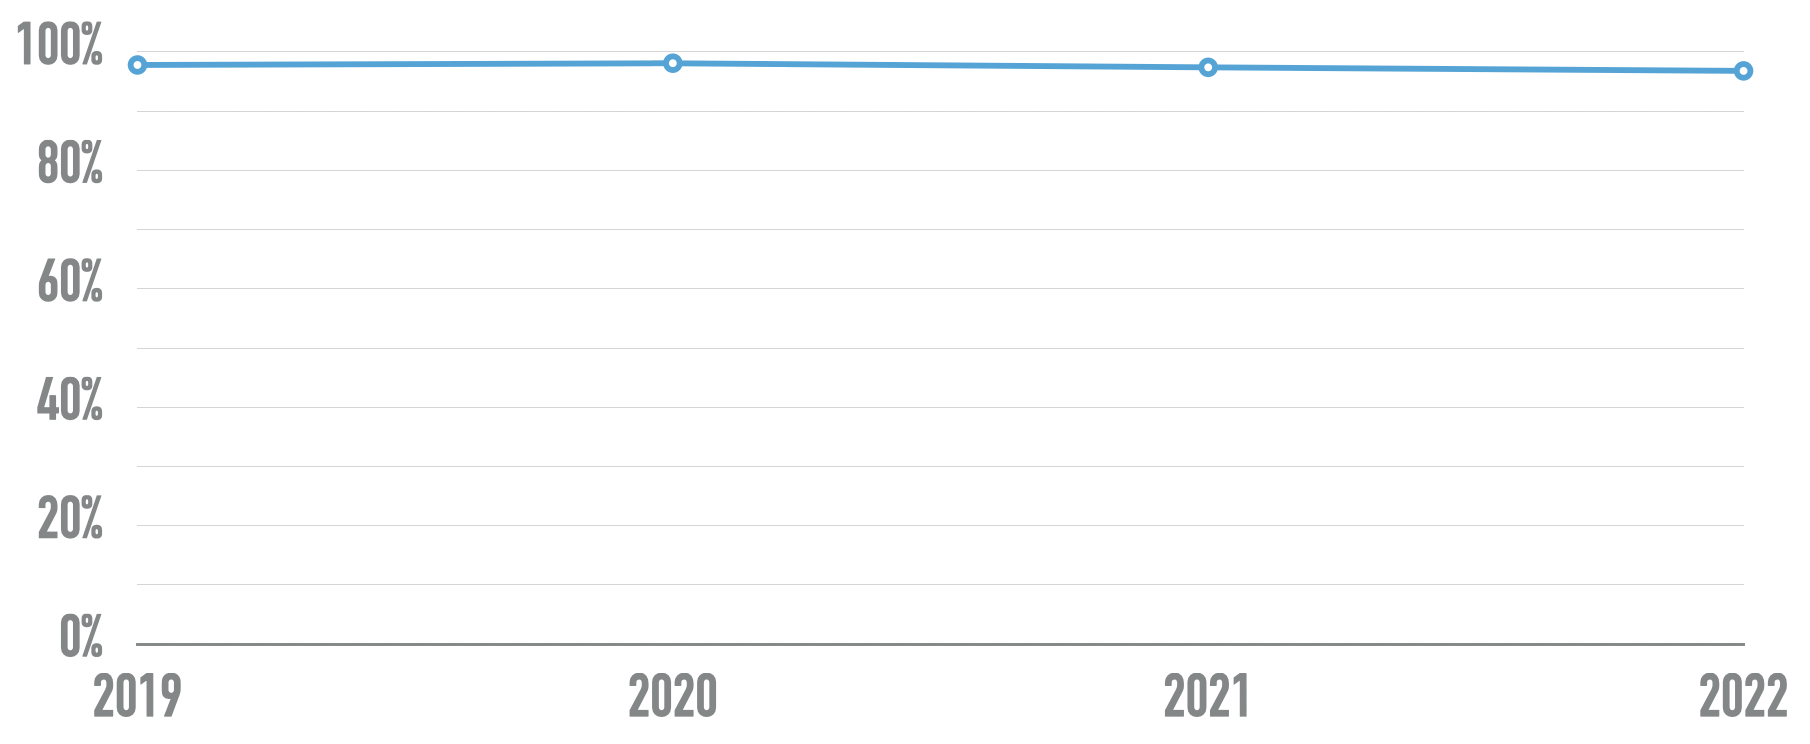
WCAG Conformance
96.8% of home pages had detected WCAG 2 failures! This improved very slightly from 97.4% in February 2021 and 97.8% in 2019. These are only automatically detected errors that align with WCAG conformance failures with a high level of reliability. Because automatic testing cannot detect all possible WCAG failure types, this means that the actual WCAG 2 A/AA conformance level was certainly lower.
This chart shows the percentage of home pages with detected WCAG conformance failures over time:
While the rate of pages with no detectable errors was very low, 21.6% of pages had 5 or fewer detected errors and 31.3% had 10 or fewer. Most conformance failures fall into just a few categories, as described below.
| WCAG Failure Type | % of home pages in 2022 | % of home pages in 2021 | % of home pages in 2020 | % of home pages in 2019 |
|---|---|---|---|---|
| Low contrast text | 83.9% | 86.4% | 86.3% | 85.3% |
| Missing alternative text for images | 55.4% | 60.6% | 66.0% | 68.0% |
| Empty links | 50.1% | 51.3% | 59.9% | 58.1% |
| Missing form input labels | 46.1% | 54.4% | 53.8% | 52.8% |
| Empty buttons | 27.2% | 26.9% | 28.7% | 25.0% |
| Missing document language | 22.3% | 28.9% | 28.0% | 33.1% |
96.5% of all errors detected fall into these six categories. These most common errors have been the same for the last 4 years. Addressing just these few types of issues would significantly improve accessibility across the web.
Low Contrast Text
Low contrast text, below the WCAG 2 AA thresholds, was found on 83.9% of home pages. This was the most commonly-detected accessibility issue. On average, each home page had 31.6 distinct instances of low-contrast text.
Images and Alternative Text
There were 39,750,181 images in the sample, or 39.8 images per home page on average. The number of images increase 4.7% since 2021. 23.2% of all home page images (9.2 per page on average) had missing alternative text (not counting alt=""). Nearly half of the images missing alternative text were linked images—resulting in links that were not descriptive.
10.4% of images with alternative text had questionable or repetitive alternative text—such as alt="image", "graphic", "blank", a file name, etc., or alternative text identical to adjacent text or alternative text.
These data show that one may expect over one third of the images on popular home pages to have missing, questionable, or repetitive alternative text.
Form Labeling
39% of the 4.4 million form inputs identified were not properly labeled (either via <label>, aria-label, aria-labelledby, or title). This is a notable improvement from 45% in 2021, 55% in 2020, and 59% in 2019.
Headings
Nearly 23.2 million headings were detected (over 23 on average per home page). The number (and prevalence) of heading levels were:
- 1.7 million
<h1>headings (7.2%) - 7.2 million
<h2>headings (31.0%) - 8.2 million
<h3>headings (35.0%) - 3.8 million
<h4>headings (16.4%) - 1.6 million
<h5>headings (6.8%) - .8 million
<h6>headings (3.4%)
The number of headings present on analyzed home pages increased 8% from 21.5 million in 2021. The prevalence of all heading levels also increased.
Because headings are the primary mechanism used by screen reader users to navigate content, their proper implementation is important. 19.6% of home pages had more than one <h1>—an increase from 18.4% in 2021. There were 1,092,097 instances of skipped heading levels (e.g., jumping from <h2> to <h4>) and 1 in every 21 headings was improperly structured. Skipped headings were present on 40.4% of all pages (up from 38.4% in 2021), and 9.9% of pages had no headings present at all (down from 10.6% in 2021).
Regions
75.3% of home pages had at least one region (or ARIA landmark) defined—an increase from 69.1% in 2021, 68.9% in 2020 and 62.4% in 2019. A <main> element or main landmark was present on 36% of home pages, up from 30.1% in 2021, 27.8% in 2020 and 23.5% in 2019. 19.9% of home pages had a "search" landmark, up from 17.6% in 2021.
96% of home pages with a main region/landmark had only one instance (which is a correct implementation). Pages with a navigation region/landmark present averaged 2.3 of them per page.
ARIA
60,227,207 ARIA attributes were detected—over 60 per page on average! ARIA code usage increased 26% in just one year and has nearly tripled since 2019.
Home pages averaged 11.4 aria-label, aria-labelledby, or aria-describedby attributes. The prevalence of ARIA labels and descriptions nearly doubled in 2 years.
74.6% of the one million home pages used ARIA (excluding ARIA landmark roles)—an increase from 68.1% in 2021, 64.6% in 2020, and 60.1% in 2019. Home pages with ARIA present averaged 70% more detected errors than those without ARIA—one would expect to encounter an additional 23 potential barriers on home pages with ARIA present.
Increased ARIA usage on pages correlated to higher detected errors. The more ARIA attributes that were present, the more detected accessibility errors could be expected. This does not necessarily mean that ARIA introduced these errors (these pages are more complex), but pages typically had more errors when ARIA was present.
4.7% of home pages had an ARIA menu (role="menu"), but 33% of ARIA menus introduced accessibility barriers due to the lack of necessary ARIA menu markup and interactions.
Home pages also averaged 11 aria-hidden="true" attributes (up from 8.9 in 2021 and 6.6 in 2020) and 2.5 role="button" attributes (up from 2.2 in 2021 and 1.3 in 2020) per page. Over 16.6 million (16.6 per page on average) instances of tabindex=0 or tabindex=-1 were present (up 62% from 2020).
Links
18% of pages had ambiguous link text, such as "click here", "more", "continue", etc. These pages had 5.9 instances of ambiguous links on average resulting in nearly 1.1 million ambiguous links in the sample.
Skip Links
14% of home pages had a "skip" link present. However, one out of every eleven "skip" links were broken—either they were hidden in a way that made them inaccessible or the link target was not present in the page.
Doctypes
86.1% of home pages had a valid HTML5 doctype—a notable increase from 79.1% in 2021. Pages with a valid HTML5 doctype had nearly double the page elements (average of 1013 vs. 595) and 15% more errors (average of 51.8 vs. 45) than those with other doctypes. 700 unique doctypes were encountered in the million-page sample.
Site Categories
We're grateful for the support of webshrinker.com in providing us the site category data. Their support makes this valuable information available.
The home pages were categorized based on content into IAB Content Taxonomy categories. The table below shows the number of home pages in each category (some sites may be in more than one category), average number of errors in that category, and the percent difference in errors for that category from the average of 50.8 errors for the entire million-page sample. In other words, the percentage difference is how much better or worse that category is than the average home page.
| Category | # of home pages | # of errors (difference from average) |
|---|---|---|
| Law, Government, and Politics | 30,570 | 29.5 (−41.9%) |
| Social Media | 7,874 | 39.2 (−22.9%) |
| Science | 10,211 | 43.7 (−13.9%) |
| Technology and Computing | 175,396 | 44.2 (−13.0%) |
| Society | 21,959 | 44.4 (−12.6%) |
| Education | 58,032 | 44.9 (−11.6%) |
| Business | 83,300 | 45.0 (−11.5%) |
| Food and Drink | 27,438 | 46.4 (−8.7%) |
| Health and Fitness | 52,941 | 47.1 (−7.3%) |
| Family and Parenting | 5,585 | 48.9 (−3.9%) |
| Careers | 11,408 | 49.8 (−2.0%) |
| Personal Finance | 31,452 | 50.2 (−1.2%) |
| Religion and Spirituality | 12,047 | 52.2 (2.7%) |
| Home and Garden | 23,876 | 53.0 (4.3%) |
| Travel | 38,325 | 55.2 (8.6%) |
| Pets | 7,139 | 55.4 (9.0%) |
| Arts and Entertainment | 45,883 | 55.8 (9.7%) |
| Hobbies and Interests | 84,437 | 57.5 (13.1%) |
| Automotive | 15,426 | 57.9 (13.9%) |
| Sports | 36,659 | 62.0 (22.1%) |
| Style and Fashion | 16,823 | 64.1 (26.1%) |
| News/Weather/Information | 73,153 | 66.9 (31.6%) |
| Real Estate | 14,516 | 68.2 (34.2%) |
| Shopping | 37,188 | 72.9 (43.4%) |
| Adult Content | 18,048 | 91.4 (79.7%) |
There were notable differences in accessibility errors for sites in different categories. Home pages in the Food and Drink category were most improved since 2020 with errors reduced from 66.1 to 46.4 errors on average. This improvement may be partially attributed to the significant increase in litigation regarding web accessibility in this sector. Shopping sites, which were also highly subject to accessibility complaints and lawsuits, were greatly improved from 90.5 errors to 72.9 errors on average over two years, yet this category remains among the least accessible.
TLDs
793 unique top-level domains (e.g., com, .tv, .fashion, etc.) were represented in the million pages analyzed. Home pages with .com (492,206), .org (81,625), and .net (42,296) were the most common.
The table below shows the most common TLDs (n>5,000) with page counts, average number of errors, and percentage difference between from the average of 50.8 errors for the entire million-page sample.
| Top-level Domain | # of home pages | # of errors (difference from average) |
|---|---|---|
| gov | 5,686 | 21.3 (−58.0%) |
| edu | 13,768 | 30.1 (−40.7%) |
| ca | 8,269 | 33.2 (−34.8%) |
| uk | 25,867 | 37.2 (−26.8%) |
| io | 10,595 | 38.9 (−23.5%) |
| org | 81,625 | 40.1 (−21.1%) |
| au | 9,689 | 51.4 (−10.2%) |
| net | 42,296 | 45.7 (−10.1%) |
| co | 7,405 | 46.6 (−8.3%) |
| jp | 15,663 | 47.2 (−7.2%) |
| nl | 7,731 | 47.4 (−6.8%) |
| info | 6,764 | 47.7 (−6.1%) |
| de | 27,576 | 48.6 (−4.5%) |
| fr | 9,433 | 49.4 (−2.9%) |
| com | 492,206 | 51.4 (+1.1%) |
| br | 5,946 | 55.4 (+9.0%) |
| in | 15,202 | 60.6 (+19.2%) |
| pl | 6,810 | 60.6 (+19.3%) |
| it | 9,810 | 62.3 (+22.6%) |
| ru | 28,858 | 73.0 (+43.7%) |
| cn | 6,857 | 78.7 (+54.9%) |
This shows notable differences between TLDs. Home pages with .gov (21.3 errors), .edu (30.1 errors), and .us (31.0 errors), which are all affiliated with U.S.-based entities, had among the lowest number of average accessibility errors of all common (n>2000) TLDs.
Languages
77% of pages specified a document language. Despite being a WCAG failure, pages without a language defined had fewer errors on average than most pages with a language defined.
This table shows the specified page language for the most common languages, number of pages in the sample, average number of errors, and percentage difference in errors from the overall average.
| Specified Language | # of home pages | # of errors (difference from average) |
|---|---|---|
| English | 553,391 | 45.3 (−10.9%) |
| No language specified | 216,277 | 48.2 (−5.2%) |
| Dutch | 7,351 | 51.1 (+0.5%) |
| Japanese | 24,833 | 53.4 (+5.1%) |
| German | 29,509 | 54.4 (+7.0%) |
| French | 19,494 | 59.5 (+17.1%) |
| Portuguese | 6,957 | 60.5 (+19.1%) |
| Spanish | 25,012 | 63.3 (+24.4%) |
| Polish | 5,559 | 67.7 (+33.2%) |
| Italian | 9,883 | 71.6 (+40.8%) |
| Arabic | 8,753 | 78.1 (+53.6%) |
| Russian | 27,725 | 78.8 (+55.0%) |
| Turkish | 6,306 | 81.2 (+59.8%) |
| Chinese | 10,166 | 85.8 (+68.7%) |
| Farsi | 7,298 | 86.9 (+71.0%) |
As with TLDs, there are significant differences in accessibility of pages in various languages. Chinese and Farsi pages had nearly twice as many detectable errors than pages in English.
Technologies
Over 1,200 different types of web technologies were detected on the one million home pages. Common technologies detected on more than 5,000 home pages are listed below, ordered from "best" to "worst". Note that correspondence of additional errors with a technology cannot automatically be attributed to that technology.
Content Management Systems
| CMS | # of home pages | Avg. # of errors | % difference |
|---|---|---|---|
| Squarespace | 6,438 | 19.2 | −62.2% |
| Wix | 7,066 | 22.7 | −55.4% |
| Drupal | 26,393 | 43.3 | −14.8% |
| Typo3 | 5,173 | 47.0 | −7.6% |
| Joomla | 8,885 | 47.9 | −5.8% |
| WordPress | 305,429 | 53.7 | +5.7% |
| Rocket | 25,029 | 54.1 | +6.3% |
| Elementor | 42,708 | 54.3 | +6.9% |
| Blogger | 7,446 | 120.0 | +136.0% |
There was a wide diversity in the impact that the CMS choice appeared to have on accessibility with home pages. Blogger, for example, had 6 times as many errors on average as home pages using Squarespace.
JavaScript Frameworks
| Framework | # of home pages | Avg. # of errors | % difference |
|---|---|---|---|
| Stimulus | 6,217 | 45.8 | −10.0% |
| Emotion | 6,683 | 46.4 | −8.7% |
| Zone.js | 5,001 | 50.4 | −0.8% |
| Angular | 5,088 | 50.7 | −0.3% |
| React | 50,612 | 50.8 | −0.1% |
| styled-components | 9,717 | 51.4 | +1.0% |
| MooTools | 6,056 | 52.2 | +2.7% |
| AngularJS | 8,957 | 58.4 | +14.9% |
| GSAP | 42,111 | 60.0 | +18.1% |
| Vue.js | 22,349 | 63.4 | +24.8% |
| Handlebars | 11,387 | 66.9 | +31.6% |
| RequireJS | 12,540 | 68.9 | +35.5% |
| Mustache | 7,616 | 69.7 | +37.1% |
| Backbone.js | 12,876 | 71.2 | +40.1% |
The adoption of most of these common frameworks corresponded with more accessibility errors than the average home page. This does not necessarily mean that the frameworks caused these errors, but home pages with these frameworks had more errors than on average.
JavaScript Libraries
| Library | # of home pages | Avg. # of errors | % difference |
|---|---|---|---|
| YUI | 8,405 | 28.2 | −44.6% |
| Polyfill | 17,143 | 44 | −13.3% |
| jQuery Mobile | 7,399 | 48.5 | −4.6% |
| Lodash | 32,435 | 51.0 | +0.3% |
| Modernizr | 96,742 | 55.4 | +8.9% |
| jQuery Migrate | 272,861 | 56.5 | +11.1% |
| Boomerang | 19,641 | 57.1 | +12.3% |
| Lightbox | 39,717 | 57.6 | +13.4% |
| Flickity | 14,365 | 57.7 | +13.6% |
| jQuery | 258,291 | 58.3 | +14.7% |
| Hammer.js | 17,165 | 59.0 | +16.0% |
| LazySizes | 70,571 | 59.4 | +16.8% |
| core-js | 312,570 | 59.6 | +17.2% |
| Isotope | 50,667 | 60.8 | +19.6% |
| web-vitals | 10,559 | 61.9 | +21.9% |
| jQuery UI | 166,068 | 64.2 | +26.4% |
| DataTables | 8,546 | 64.8 | +27.5% |
| Axios | 6,784 | 70.2 | +38.1% |
| Underscore.js | 15,572 | 70.3 | +38.4% |
| Preact | 7,033 | 70.7 | +39.1% |
| Moment.js | 36,429 | 71.1 | +39.9% |
| prettyPhoto | 22,157 | 71.4 | +40.4% |
| FancyBox | 47,132 | 71.8 | +41.2% |
| Slick | 58,881 | 73.6 | +44.8% |
| Select2 | 33,888 | 76 | +49.6% |
| SweetAlert2 | 6,651 | 84.7 | +66.6% |
With the exception of YUI, Polyfill, and jQuery Mobile, the presence of any of these popular JavaScript libraries aligned with an increase in detected accessibility errors.
Web Frameworks
| Web Framework | # of home pages | Avg. # of errors | % difference |
|---|---|---|---|
| Next.js | 9,180 | 44.5 | −12.5% |
| Microsoft ASP.net | 45,720 | 48.2 | −5.1% |
| ZURB Foundation | 18,141 | 53.3 | +4.8% |
| Ruby | 10,071 | 54.5 | +7.2% |
| Express | 8,510 | 54.9 | +8.0% |
| UIkit | 5,105 | 56.6 | +11.3% |
| Bootstrap | 245,392 | 60.5 | +19.1% |
| Animate.css | 51,562 | 63.5 | +25.0% |
| Laravel | 7,214 | 69.3 | +36.4% |
| CodeIgniter | 5,766 | 71.5 | +40.7% |
Home pages in the sample that utilize the popular Bootstrap framework had 9.6 more accessibility errors on average than those that did not. We can't know from these data if Bootstrap introduced these errors, but there was a correspondence of increased errors when Bootstrap was present.
Ecommerce Platforms
| Platform | # of home pages | Avg. # of errors | % difference |
|---|---|---|---|
| Squarespace | 6,438 | 19.2 | −62.2% |
| Shopify | 16,624 | 58.5 | +15.1% |
| Woocommerce | 39,023 | 68.5 | +34.8% |
| Magento | 5,309 | 83.4 | +64.1% |
As in other categories, there were large disparities in detected errors across Ecommerce platforms, with home pages using Magento, for example, having over four times as many errors as pages using Squarespace.
Advertisement Networks
| Ad Network | # of home pages | Avg. # of errors | % difference |
|---|---|---|---|
| AdRoll | 5,801 | 53.4 | +5.1% |
| Microsoft Advertising | 23,048 | 55.7 | +9.6% |
| Pinterest Ads | 11,509 | 57.0 | +12.1% |
| Twitter Ads | 51,149 | 62.6 | +23.1% |
| AppNexus | 10,032 | 63.3 | +24.5% |
| Amazon Advertising | 14,839 | 68.1 | +33.9% |
| Google AdSense | 83,737 | 74.8 | +47.2% |
| Prebid | 14,663 | 77.8 | +53.0% |
| Doubleclick | 20,844 | 79.1 | +55.6% |
| Pubmatic | 8,693 | 80.5 | +58.3% |
| 33Across | 6,865 | 85.5 | +68.2% |
| Yandex | 29,424 | 86.4 | +70.0% |
| Criteo | 12,277 | 89.4 | +75.9% |
Pages that utilized any of these popular ad systems had more errors on average than those that did not. The data suggest that ads were among the strongest harbingers of accessibility errors. Home pages that utilize the common Google AdSense system had 23.9 more errors on average than other pages.
Other Technologies
Other common technologies also correlated to more errors. 7.1% of pages had ReCAPTCHA and averaged 13.8 more errors than those without. 36.5% of pages had Google Fonts and averaged 4.8 more errors. 2.7% of pages had Google Maps and averaged 10.7 more errors.
Fun Facts
Here are some fun facts regarding this research:
- With 5 analyses of over one million pages each, the WebAIM Million database is approaching four billion data points.
- Despite being 2022, 9,152 home pages had
<marquee>and 373 home pages had blinking content (<blink>or CSStext-decoration:blink). - 1,298,423 tables were observed (down from 1,533,402 in 2021) on 179,966 pages. Only 175,700 (13.5%) of the tables had valid data table markup.
- The most errors detected on a single home page was 68,826!
Conclusion
While our 2022 analysis saw small decreases in the number of detected accessibility errors and WCAG conformance failures, significant work remains to be done to make the web accessible to everyone. We at WebAIM hope that this report will help influence improved accessibility.