
Screen Reader User Survey #11 Results
Introduction
In July-August 2026, WebAIM surveyed preferences of screen reader users. We received 1780 valid responses. This was a follow-up to 10 previous surveys conducted between January 2009 and January 2024.
A few disclaimers and notices:
- Totals may not equal 100% due to rounding.
- Total responses (n) for each question may not equal 1780 due to some respondents not answering a particular question.
- The sample was not controlled and may not represent all screen reader users.
- We hope to conduct additional surveys of this nature again in the future. If you have recommendations or questions that you would like us to ask, please contact us.
Demographics
Region
| Region | # of Respondents | % of Respondents |
|---|---|---|
| North America | 931 | 54.1% |
| Europe | 477 | 27.7% |
| Asia | 106 | 6.2% |
| Africa/Middle East | 88 | 5.1% |
| South America | 64 | 3.7% |
| Australia and Oceania | 47 | 2.7% |
| Central America and Caribbean | 8 | 0.5% |
When survey responses were notably different between regions, it is noted below.
Disability
| Response | # of Respondents | % of Respondents |
|---|---|---|
| Yes | 1687 | 94.8% |
| No | 93 | 5.2% |
Responses are predominantly very similar for respondents with and without disabilities. Any notable differences are indicated below to highlight differences in practices and perceptions between disabled and non-disabled respondents.
Disability Types
| Response | # of Respondents | % of Respondents |
|---|---|---|
| Blindness | 1481 | 83.2% |
| Low Vision/Visually-Impaired | 321 | 18.0% |
| Cognitive or Learning | 53 | 3.0% |
| Deafness/Hard-of-Hearing | 133 | 7.5% |
| Motor | 33 | 1.9% |
| Other | 54 | 3.0% |
301 respondents (16.9%) reported multiple disabilities. 115 respondents (6.5%) reported being both deaf/hard-of-hearing and blind.
Screen Reader Proficiency
| Response | # of Respondents | % of Respondents |
|---|---|---|
| Advanced | 1014 | 57.8% |
| Intermediate | 681 | 38.8% |
| Beginner | 60 | 3.4% |
Those who use screen readers due to a disability reported themselves as more proficient with screen readers—60% of those with disabilities considered their proficiency to be "Advanced" compared to only 18.3% of those without disabilities.
Internet Proficiency
| Response | # of Respondents | % of Respondents |
|---|---|---|
| Advanced | 1134 | 64.6% |
| Intermediate | 580 | 33.0% |
| Beginner | 42 | 2.4% |
Those without disabilities rated themselves as more proficient (87% reported as "Advanced") than those with disabilities (63% reported as "Advanced").
Primary Desktop/Laptop Screen Reader
| Response | # of Respondents | % of Respondents |
|---|---|---|
| JAWS | 975 | 55.0% |
| NVDA | 584 | 32.9% |
| VoiceOver | 116 | 6.5% |
| ZoomText/Fusion | 37 | 2.1% |
| Orca | 25 | 1.4% |
| Narrator | 7 | 0.4% |
| Dolphin SuperNova | 3 | 0.2% |
| ChromeVox | 1 | 0.1% |
| Other | 25 | 1.4% |
The following chart shows historical trends for primary screen reader usage.
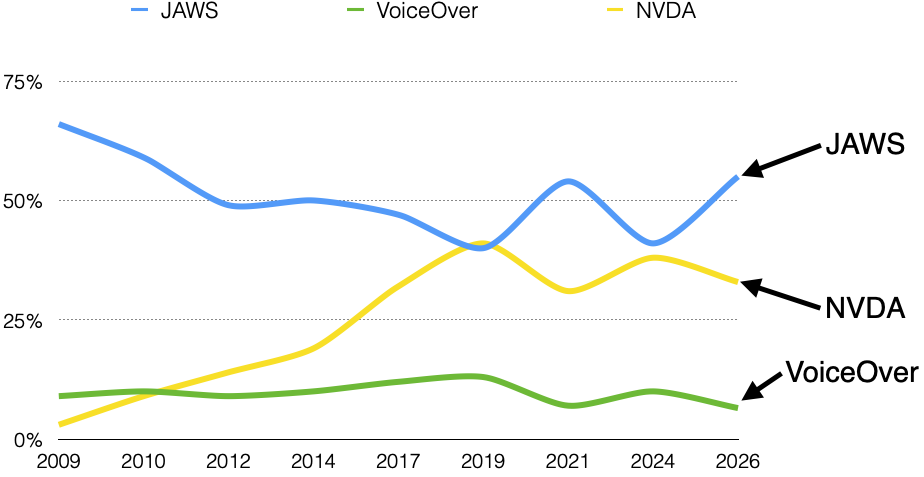
2026 saw a resurgence in respondents reporting JAWS as their primary screen reader with both NVDA and VoiceOver declining since 2024.
Primary usage varied greatly by region. JAWS usage was higher than NVDA in North America (72.5% vs. 15.6%) and Australia (59.6% vs. 29.8%). JAWS and NVDA usage were about the same in Europe (42.8% vs. 42.3%). JAWS usage was significantly lower than NVDA in Africa/Middle East (13.6% vs. 83%), Asia (17% vs. 77.4%), and South America (18.8% vs. 67.2%). This survey had a slightly higher number of respondents from North America where JAWS is more frequently used, but this alone does not account for the notable increase in overall JAWS usage.
VoiceOver was significantly more popular among respondents without disabilities (21.7% use VoiceOver) than with users with disabilities (5.7% use VoiceOver).
Beyond the three most popular primary screen readers, all other screen readers comprised a total of 5.5% of usage (down from 12.2% in 2024).
Screen Readers Commonly Used
| Response | # of Respondents | % of Respondents |
|---|---|---|
| JAWS | 1232 | 69.2% |
| NVDA | 1056 | 59.3% |
| VoiceOver | 747 | 42.0% |
| Narrator | 643 | 36.1% |
| ZoomText/Fusion | 130 | 7.3% |
| Orca | 115 | 6.5% |
| ChromeVox | 65 | 3.7% |
| Dolphin SuperNova | 23 | 1.3% |
| Other | 59 | 3.3% |
The following chart shows historical trends for commonly used screen readers.
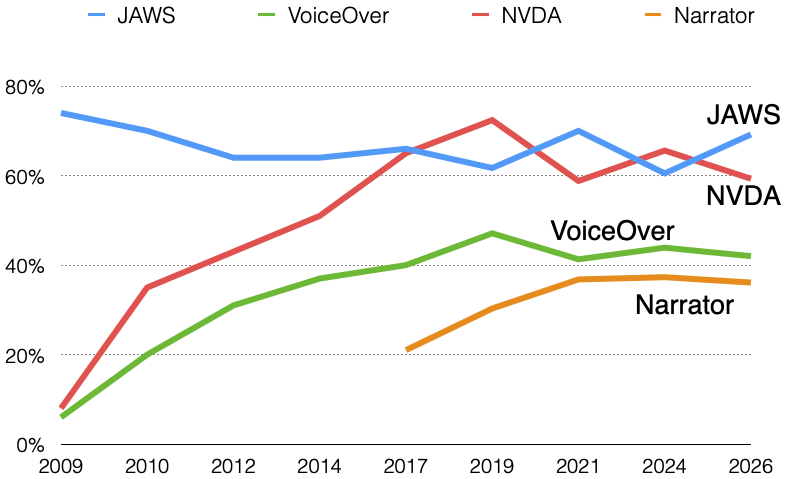
JAWS is again the most commonly used screen reader at 69.2% of respondents outpacing NVDA at 59.3%. Narrator—freely available in Windows—is the primary screen reader of only .4% of respondents, but is commonly used by 36.1% of respondents.
70.3% of respondents use more than one desktop/laptop screen reader. 38.4% use three or more, and 15.4% use four or more different screen readers.
Browsers
| Response | # of Respondents | % of Respondents |
|---|---|---|
| Chrome | 924 | 52.3% |
| Microsoft Edge | 417 | 23.6% |
| Firefox | 281 | 15.9% |
| Safari | 85 | 4.8% |
| Other | 61 | 3.5% |
The following chart shows historical trends for browser usage with a screen reader.
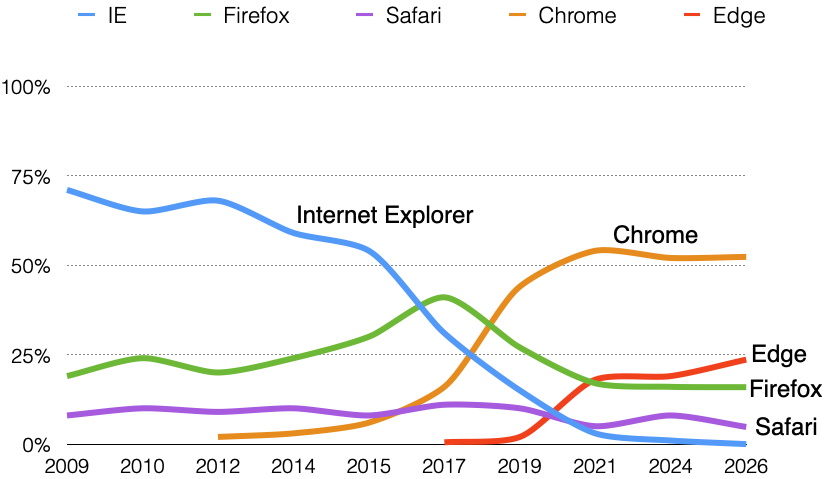
Browser usage remains relatively unchanged in recent years. Chrome and Firefox usage remained steady since 2024 with Edge usage increasing and Safari and other browser usage decreasing.
Screen Reader / Browser Combinations
| Screen Reader & Browser | # of Respondents | % of Respondents |
|---|---|---|
| JAWS with Chrome | 549 | 31.2% |
| NVDA with Chrome | 304 | 17.3% |
| JAWS with Edge | 299 | 17.0% |
| NVDA with Firefox | 160 | 9.1% |
| NVDA with Edge | 95 | 5.4% |
| JAWS with Firefox | 88 | 5.0% |
| VoiceOver with Safari | 76 | 4.3% |
| VoiceOver with Chrome | 28 | 1.6% |
There are many combinations of browsers and screen readers in use, with JAWS with Chrome the most common by a substantial margin.
Operating System
| Response | # of Respondents | % of Respondents |
|---|---|---|
| Windows | 1607 | 90.7% |
| Mac | 112 | 6.3% |
| Linux | 28 | 1.6% |
| Other | 24 | 1.4% |
Windows usage with primary screen reader increased to 90.7% from 86.1% in 2024. Respondents without disabilities were over 4 times more likely to use Mac OS than respondents with disabilities.
JavaScript
| Response | % of Respondents |
|---|---|
| Yes | 99.7% |
| No | 0.3% |
JavaScript support was detected with the survey form submission. Nearly all respondents had JavaScript enabled.
Main Reason for Use
| Response | # of Respondents | % of Respondents |
|---|---|---|
| Existing Comfort/Expertise | 867 | 49.3% |
| Features | 427 | 24.3% |
| Availability | 194 | 11.0% |
| Cost | 163 | 9.3% |
| Support | 107 | 6.1% |
Over recent years, existing comfort and features has been increasingly indicated as the main reason for primary screen reader use. JAWS and ZoomText users were more likely to indicate that existing comfort and expertise were their main reason for use (57% and 67.7% of respondents, respectively) than NVDA (36%) and VoiceOver (50.4%) users. 24.3% of NVDA users indicated cost as their primary reason compared to only 1.4% of JAWS users. Similarly, 28.7% of VoiceOver users indicated availability as their primary reason compared to 10.5% for NVDA users and 8.7% for JAWS users.
Screen Reader Satisfaction
| Response | # of Respondents | % of Respondents |
|---|---|---|
| Very satisfied | 1173 | 66.3% |
| Somewhat satisfied | 510 | 28.8% |
| Slightly satisfied | 72 | 4.1% |
| Not satisfied | 14 | 0.8% |
Respondents indicating that they are very or somewhat satisfied by their primary screen reader:
- NVDA - 96.7%
- JAWS - 95.9%
- VoiceOver - 90.3%
Free/Low-cost vs. Commercial
| Response | # of Respondents | % of Respondents |
|---|---|---|
| Yes | 1306 | 74.6% |
| No | 257 | 14.7% |
| I don't know | 188 | 10.7% |
The perception of free or low-cost screen readers as being viable alternatives has decreased slightly from 78.1% in 2024 to 74.6% in 2026.
Only 61.9% of JAWS users answered "Yes" compared to an overwhelming 91.2% of VoiceOver users and 94% of NVDA users. Those that use free or low-cost screen readers as their primary screen reader have a much better perception of them than those who do not. Respondents with "Advanced" screen reader proficiency were also more favorable of free/low-cost screen readers.
Mobile Screen Readers
Mobile Usage
| Response | # of Respondents | % of Respondents |
|---|---|---|
| Yes | 1613 | 91.8% |
| No | 144 | 8.2% |
The vast majority of respondents report using a screen reader on a mobile device. Respondents with disabilities (93.4%) are much more likely to use a mobile screen reader than respondents without disabilities (61.8%).
Mobile Platforms
| Response | # of Respondents | % of Respondents |
|---|---|---|
| Apple iPhone, iPad, or iPod touch | 1249 | 73.3% |
| Android | 410 | 24.0% |
| Chrome OS | 8 | 0.5% |
| Other | 38 | 2.2% |
Respondents with disabilities (74.1%) used iOS devices at a higher rate than those without disabilities (57%). Usage of iOS devices was significantly higher in North America (84%), Australia (78%), and Europe (72%) than in South America (44%), Asia (41%), and Africa/Middle East (34%). Respondents with more advanced screen reader and internet proficiency used iOS at higher rates than those with lower proficiency.
The following chart shows historical trends for mobile platform usage.
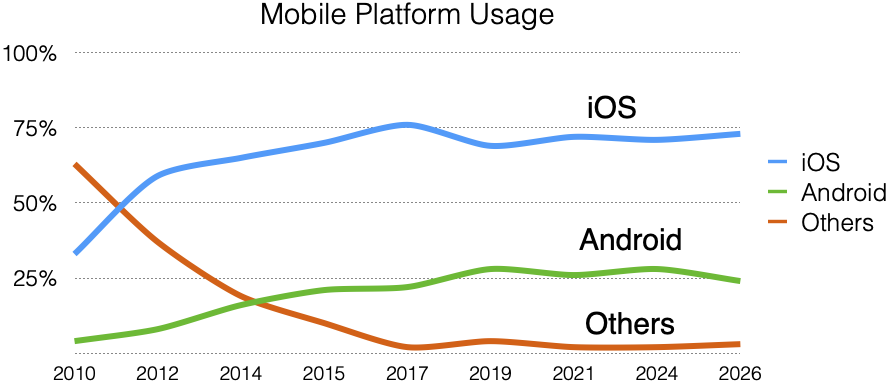
iOS devices continue to dominate the mobile screen reader market. Usage of platforms other than iOS and Android (Chrome OS, Windows Phone, Nokia, etc.) combined represent only 2.7% of reported usage.
Mobile Screen Readers Used
| Response | % of Respondents |
|---|---|
| VoiceOver | 72.2% |
| TalkBack | 29.5% |
| Commentary/Jieshuo | 8.2% |
| Voice Assistant | 5.4% |
| VoiceView | 4.2% |
| Other | 5.0% |
Primary Mobile Browser
| Response | # of Respondents | % of Respondents |
|---|---|---|
| Safari | 945 | 56.0% |
| Chrome | 475 | 28.2% |
| Firefox | 87 | 5.2% |
| IE or Edge Mobile | 36 | 2.1% |
| Other | 143 | 8.4% |
Mobile vs. Desktop/Laptop Usage
| Responses | # of Respondents | % of Respondents |
|---|---|---|
| Desktop/laptop | 751 | 42.6% |
| I use mobile/tablet and desktop/laptop screen readers about the same | 864 | 49.0% |
| Mobile/tablet device | 147 | 8.3% |
There has been almost no change to responses to this question over the last 7 years.
Mobile App vs Web Site Usage
| Response | # of Respondents | % of Respondents |
|---|---|---|
| Mobile app | 945 | 54.8% |
| Web site | 779 | 45.2% |
While the preference for mobile app usage had increased notably over the previous 3 surveys, this trend reversed with a decrease from 58% in 2024 to 54.8% in 2026. Those with disabilities (55.3%) preferred mobile apps more than respondents without disabilities (44.8%).
Web Accessibility Progress
| Response | # of Respondents | % of Respondents |
|---|---|---|
| Web content has become more accessible | 561 | 32.2% |
| Web content accessibility has not changed | 781 | 44.9% |
| Web content has become less accessible | 398 | 22.9% |
Perception of the state of web accessibility decreased slightly from 2021 to 2024 and again from 2024 to 2026. Respondents without disabilities tend to be more positive about recent progress (41% thought the web had become more accessible) than those with disabilities (31.8% thought it had become more accessible).
Impacts on Accessibility
| Response | # of Respondents | % of Respondents |
|---|---|---|
| Better assistive technology | 283 | 16.1% |
| Better (more accessible) web sites | 1475 | 83.9% |
Historically respondents have increasingly answered "better web sites" to this question—68.6% of respondents in October 2009, 75.8% in December 2010, 81.3% in January 2014, 85.3% in 2021, and 85.9% in 2024. However, in 2026, there was a slight reversal of this trend with 83.9% indicating "better web sites". This shift may indicate somewhat greater concern about the accessibility or capabilities of assistive technology relative to web content.
Respondents who were slightly/not satisfied were nearly twice as likely to say better assistive technology would have the greater impact than those that were very/somewhat satisfied: 29.8% vs. 15.2%.
Landmarks/Regions
| Response | # of Respondents | % of Respondents |
|---|---|---|
| Whenever they're available | 271 | 15.5% |
| Often | 223 | 12.8% |
| Sometimes | 572 | 32.7% |
| Seldom | 408 | 23.4% |
| Never | 273 | 15.6% |
The reported frequent usage of landmarks/regions decreased to 28.3% in 2026 from 31.8% in 2024.
Finding Information
| Response | # of Respondents | % of Respondents |
|---|---|---|
| Navigate through the headings on the page | 1191 | 67.8% |
| Read through the page | 170 | 9.7% |
| Use the Find feature | 219 | 12.5% |
| Navigate through the links of the page | 118 | 6.7% |
| Navigate through the landmarks/regions of the page | 59 | 3.4% |
The usage of headings for finding information has historically increased over time. It remains the predominant method, but decreased slightly from 71.6% in 2024 to 67.8% in 2026. Reading through the page and navigating links both increased slightly in usage compared to 2024. Those with advanced screen reader proficiency are much more likely to use headings (72.1%) than those with beginner proficiency (41.4%). Beginners are 2.7 times more likely to use the "Find" feature than those with advanced proficiency.
While 28.3% of respondents indicate that they always or often use landmarks when they are present, only 3.4% use this as a primary method for finding information on a lengthy web page.
Heading Levels
| Response | # of Respondents | % of Respondents |
|---|---|---|
| Very useful | 912 | 51.9% |
| Somewhat useful | 640 | 36.4% |
| Not very useful | 125 | 7.1% |
| Not at all useful | 38 | 2.2% |
| I don't know | 43 | 2.4% |
88.3% of respondents find heading levels very or somewhat useful.
"Skip" links
| Response | # of Respondents | % of Respondents |
|---|---|---|
| Always | 359 | 20.4% |
| Often | 305 | 17.3% |
| Sometimes | 524 | 29.8% |
| Seldom | 340 | 19.3% |
| Never | 232 | 13.2% |
Frequent usage of "skip" links (those who selected "Always" or "Often") increased from 31.2% in 2021 to 37.7% in 2026. It's important to note that "skip" links provide distinct benefits for sighted keyboard users, even if their usage among screen reader users is mixed.
PDF Document Issues
| Response | # of Respondents | % of Respondents |
|---|---|---|
| Very likely | 819 | 46.7% |
| Somewhat likely | 683 | 38.9% |
| Somewhat unlikely | 126 | 7.2% |
| Very unlikely | 65 | 3.7% |
| I don't know | 61 | 3.5% |
The large majority (85.6%) of respondents indicated that PDF documents are very or somewhat likely to pose accessibility issues. This is up from 75.1% of respondents in 2019.
86.2% of respondents with advanced screen reader proficiency reported very or somewhat likely issues with PDF files compared to 72.4% of respondents with beginner proficiency. This suggests that increased proficiency does not decrease the impact of inaccessible PDF documents.
Word Document Issues
| Response | # of Respondents | % of Respondents |
|---|---|---|
| Very likely | 167 | 9.6% |
| Somewhat likely | 376 | 21.5% |
| Somewhat unlikely | 542 | 31.0% |
| Very unlikely | 586 | 33.5% |
| I don't know | 76 | 4.4% |
Respondents were much more favorable of Word documents than of PDF documents—31.1% (nearly unchanged from 30.9% in 2019) indicated that Word documents are very or somewhat likely to pose significant accessibility issues, compared to 85.6% for PDF documents.
AI Usage
| Response | # of Respondents | % of Respondents |
|---|---|---|
| To generate image descriptions / alternative text | 1069 | 60.1% |
| To provide in-depth analysis or description of complex images | 885 | 49.7% |
| To generate text or other alternatives for multimedia content | 510 | 28.7% |
| To generate audio alternatives of text content | 318 | 17.9% |
| To provide summaries of webpages or documents | 660 | 37.1% |
| To provide guidance in performing an online task | 722 | 40.6% |
| To perform accessibility evaluations of content | 347 | 19.5% |
| Other | 290 | 16.3% |
Only 8.2% of respondents did not indicate usage of AI in any of these ways.