The WebAIM Million
The 2026 report on the accessibility of the top 1,000,000 home pages
Introduction
For the eighth consecutive year, WebAIM conducted an accessibility evaluation of the home pages for the top 1,000,000 web sites. The evaluation was conducted using the WAVE stand-alone API (with additional tools to collect site technology and category data). The results provide an overview of and insight into the current state of web accessibility for individuals with disabilities as well as trends over time.
The Sample
Site Lookup
How did your home page rank in our study? Enter a web site domain below to view details.
The million home page list was derived from the Tranco ranking which combines several sources of "top" web sites.
Sites without home pages, pages that returned errors (404, etc.), pages with fewer than 10 HTML elements, and pages with more than 5,000 links to the same domain (for SEO purposes) were not included.
Methodology
The WAVE accessibility engine was used to analyze the rendered DOM (Document Object Model) of all pages after scripting and styles were applied. WAVE detects end-user accessibility barriers and Web Content Accessibility Guidelines (WCAG) 2.2 A/AA conformance failures. All automated tools, including WAVE, have limitations—not all conformance failures can be automatically detected. Absence of detected errors does not indicate that a page is accessible or conformant. Although this report describes only a subset of accessibility issues on only 1,000,000 home pages, this report provides a quantified and reliable representation of the current state of the accessibility of the most influential pages on the web.
Detected Errors
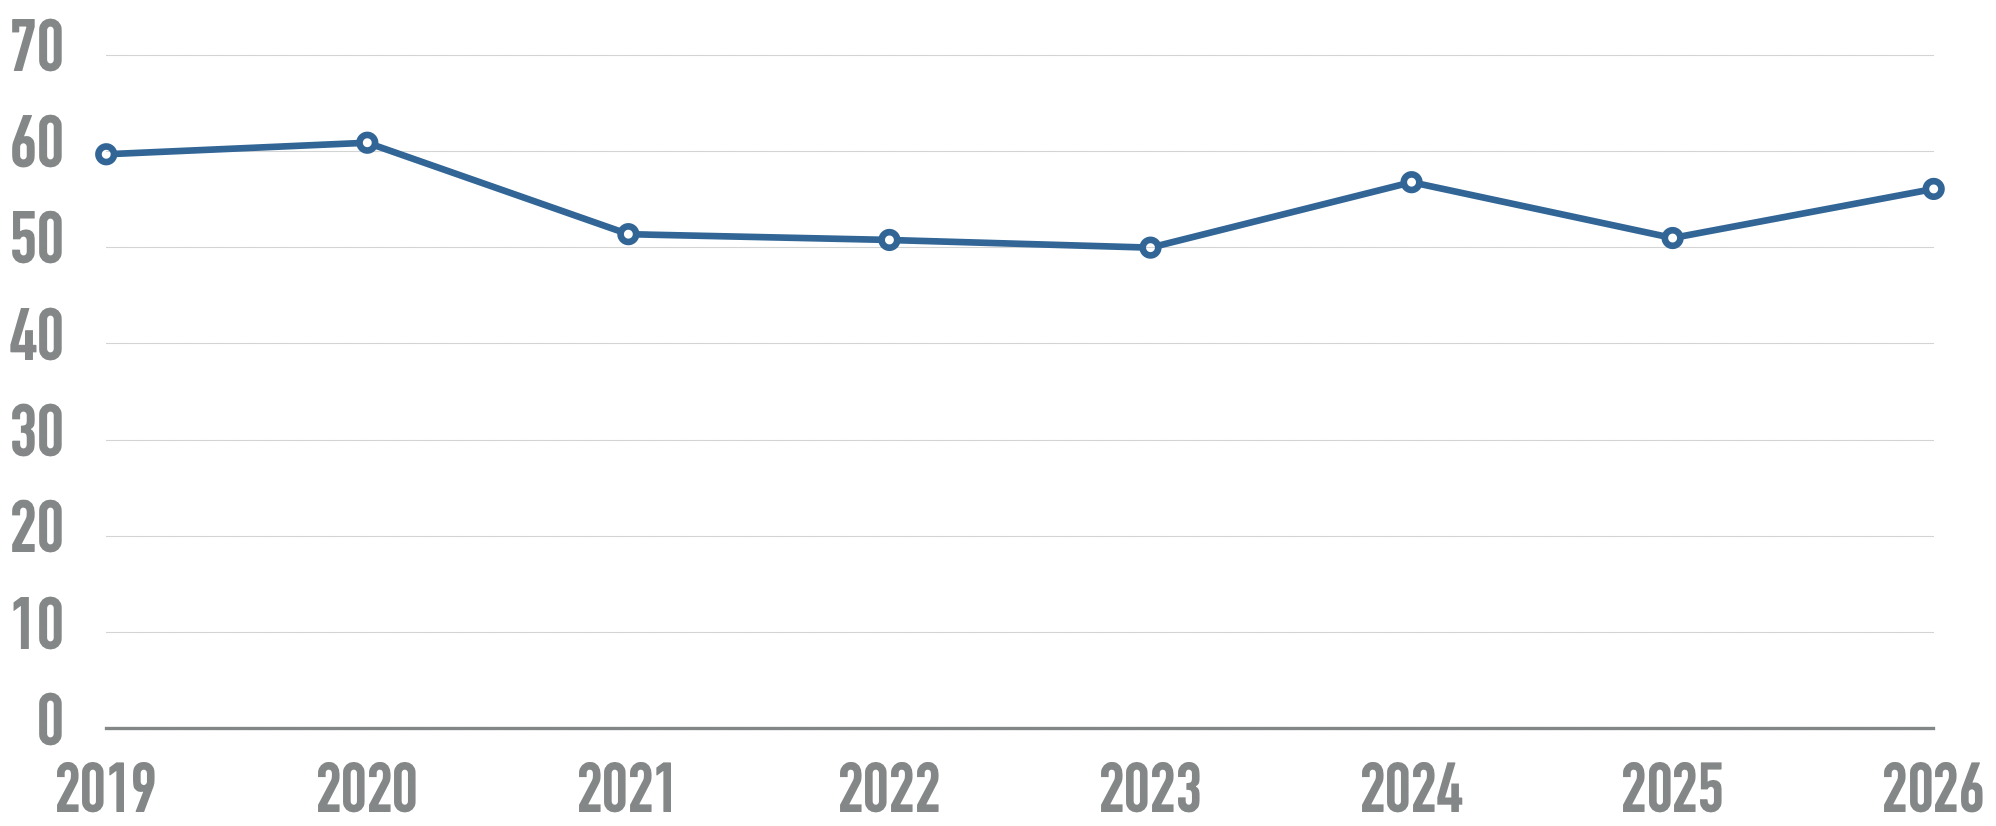
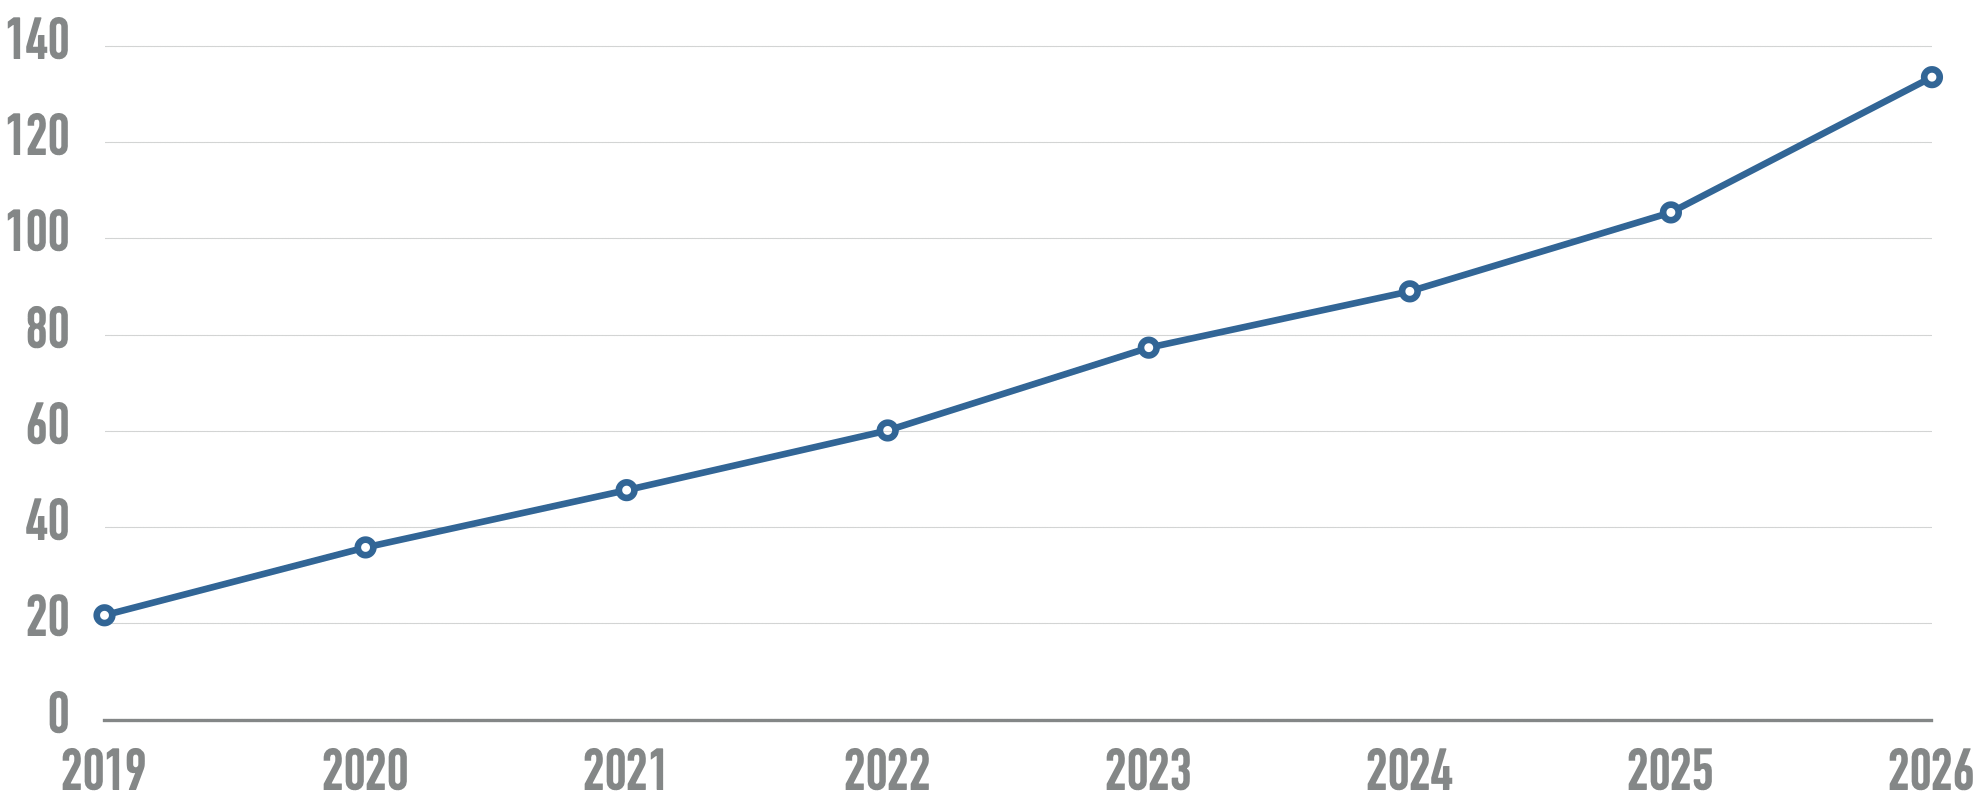
Across the one million home pages, 56,114,377 distinct accessibility errors were detected—an average of 56.1 errors per page. The number of detected errors increased 10.1% since the 2025 analysis which found 51 errors/page. "Errors" are WAVE-detected accessibility barriers having notable end user impact, and which have a very high likelihood of being WCAG 2.2 Level A/AA conformance failures.
This chart shows the average number of detectable errors per home page over time:
Home Page Complexity
The home pages tested had over 1.4 billion page elements. Home page complexity continues to steadily increase. The average number of page elements increased to 1437 per home page in February 2026—a 22.5% increase in only one year!
The following chart shows the number of home page elements detected over time:
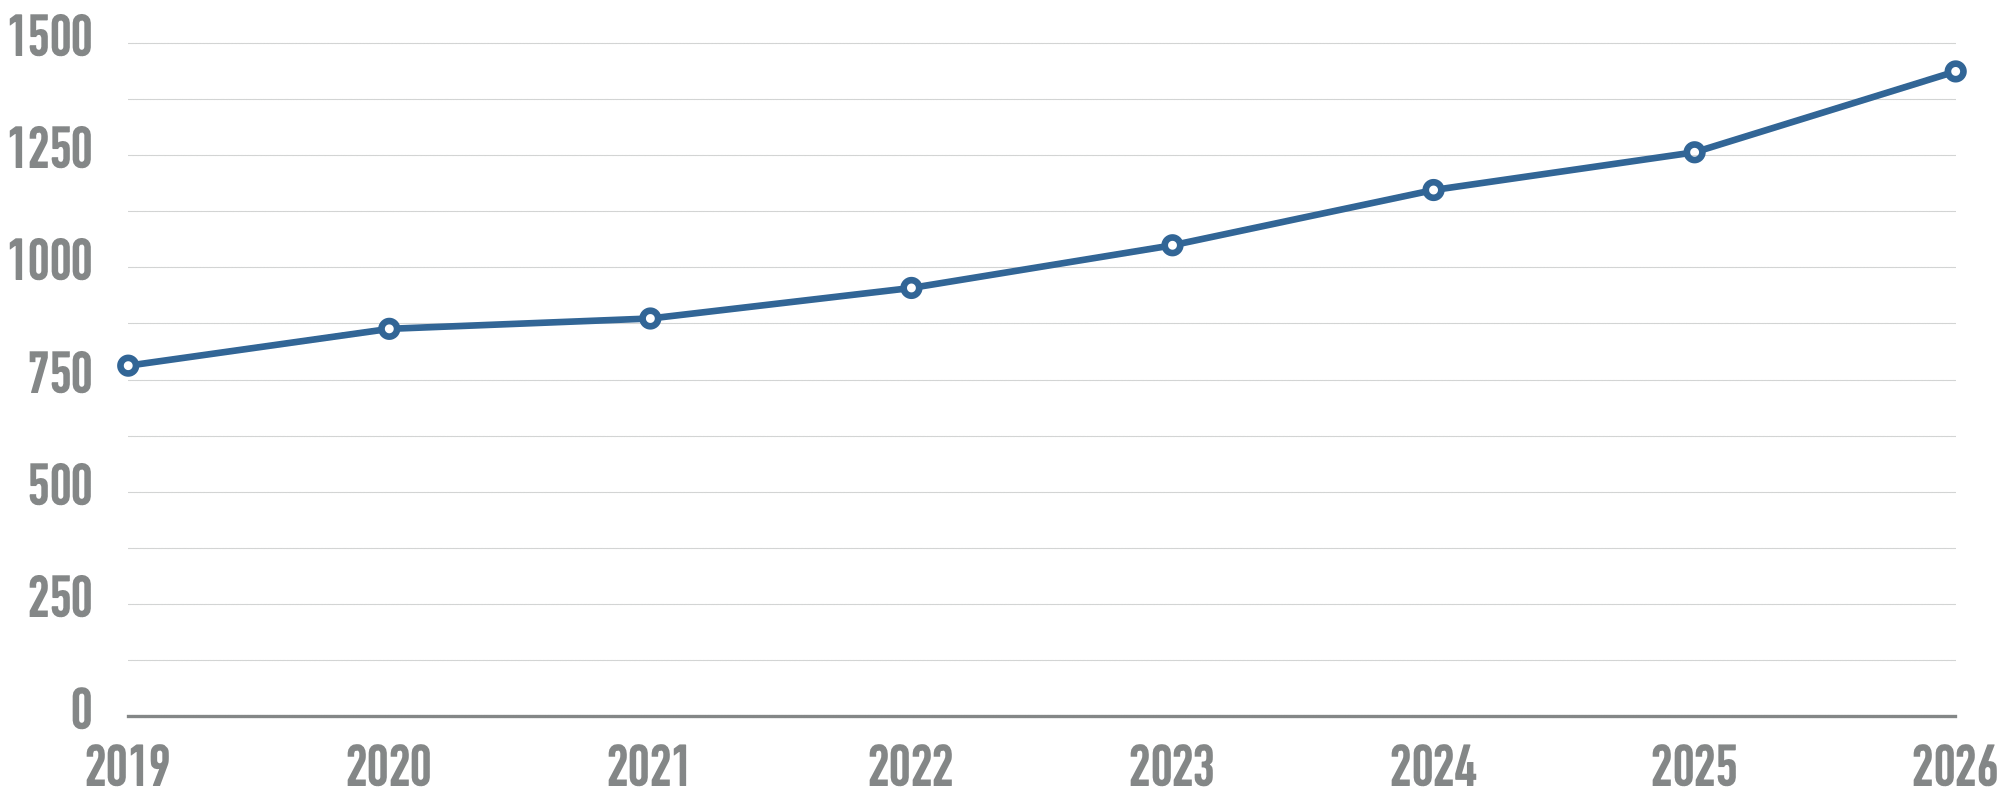
The number of home page elements has nearly doubled in the last 7 years. 3.9% of all home page elements had a detected accessibility error. Users with disabilities would expect to encounter errors on 1 in every 26 home page elements.
Error density (number of errors divided by number of page elements) is provided in the site lookup, but is alone an unreliable metric of site accessibility. A significant number of page elements (<div> and <span> elements, for example) may result in a lower error density (suggesting better accessibility), when in fact many new accessibility errors may have also been introduced. This report focuses primarily on the average number of detected errors (likely end user barriers) present rather than error density (how diluted those errors are within page elements).
There was a correlation between page popularity and home page complexity. The most popular 100,000 pages averaged 1,584 elements—20% more page elements than the least popular 100,000 sites in the million page sample (1,318 elements).
WCAG Conformance
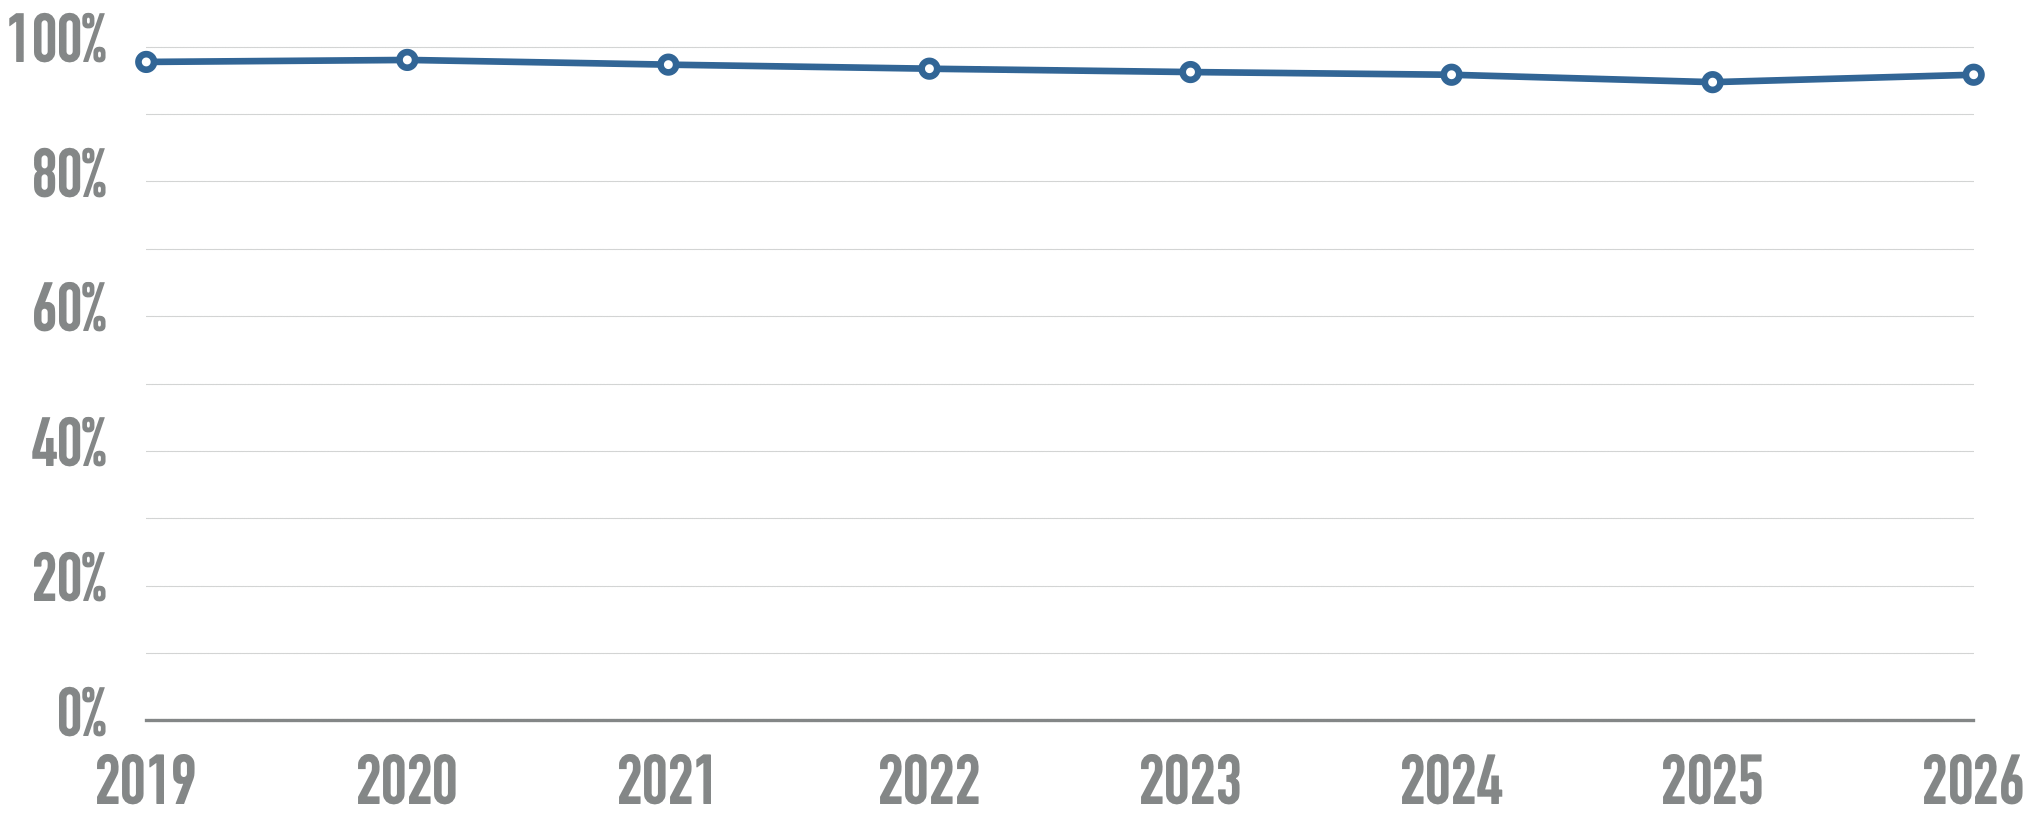
95.9% of home pages had detected WCAG 2 failures. This number increased from 94.8% in 2025—reversing a trend of small improvements each of the previous 6 years. Because only automatically detectable WCAG failures were considered, this suggests that the rate of full WCAG 2 A/AA conformance was certainly lower than 4.1%.
This chart shows the percentage of home pages with detected WCAG conformance failures over time:
While the number of pages with no detectable errors was very low, 20.5% of pages had 5 or fewer detected errors and 30.4% had 10 or fewer.
| WCAG Failure Type | % of home pages |
|---|---|
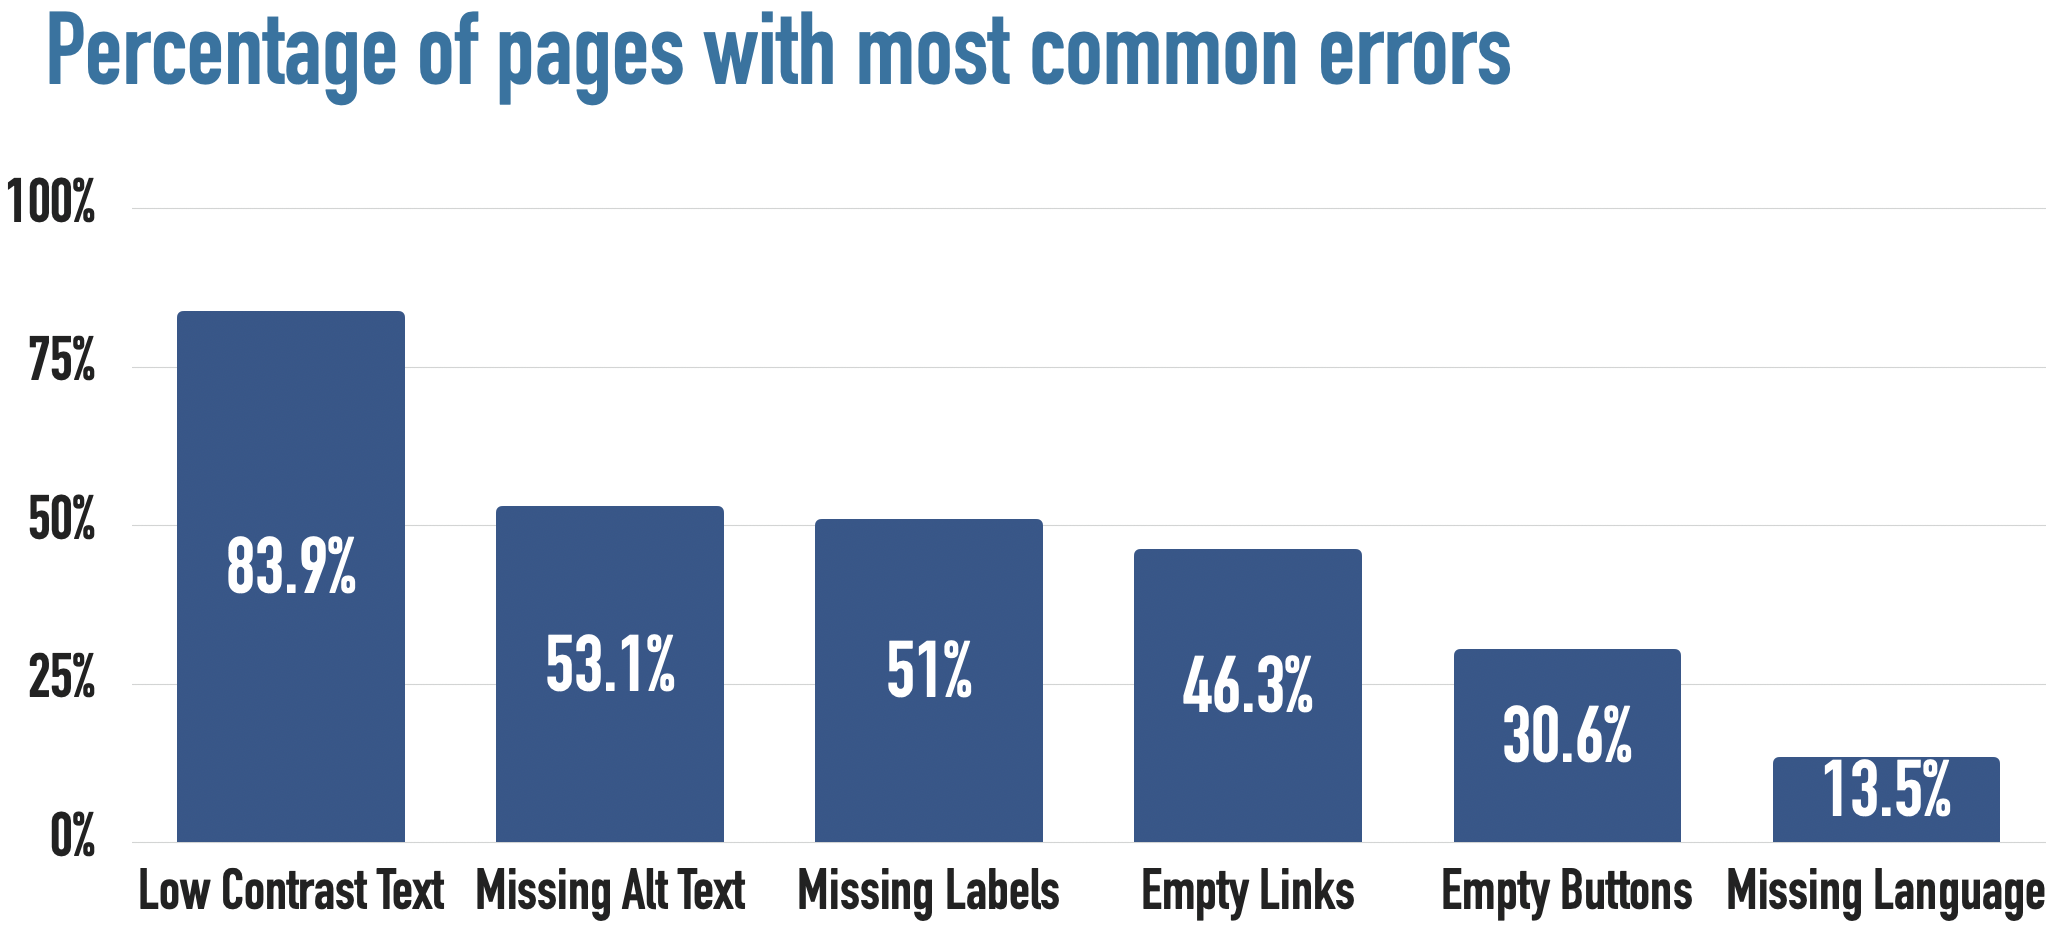
| Low contrast text | 83.9% |
| Missing alternative text for images | 53.1% |
| Missing form input labels | 51% |
| Empty links | 46.3% |
| Empty buttons | 30.6% |
| Missing document language | 13.5% |
96% of all errors detected fall into these six categories. These most common errors have been the same for the last 7 years. Addressing just these few types of issues would significantly improve accessibility across the web.
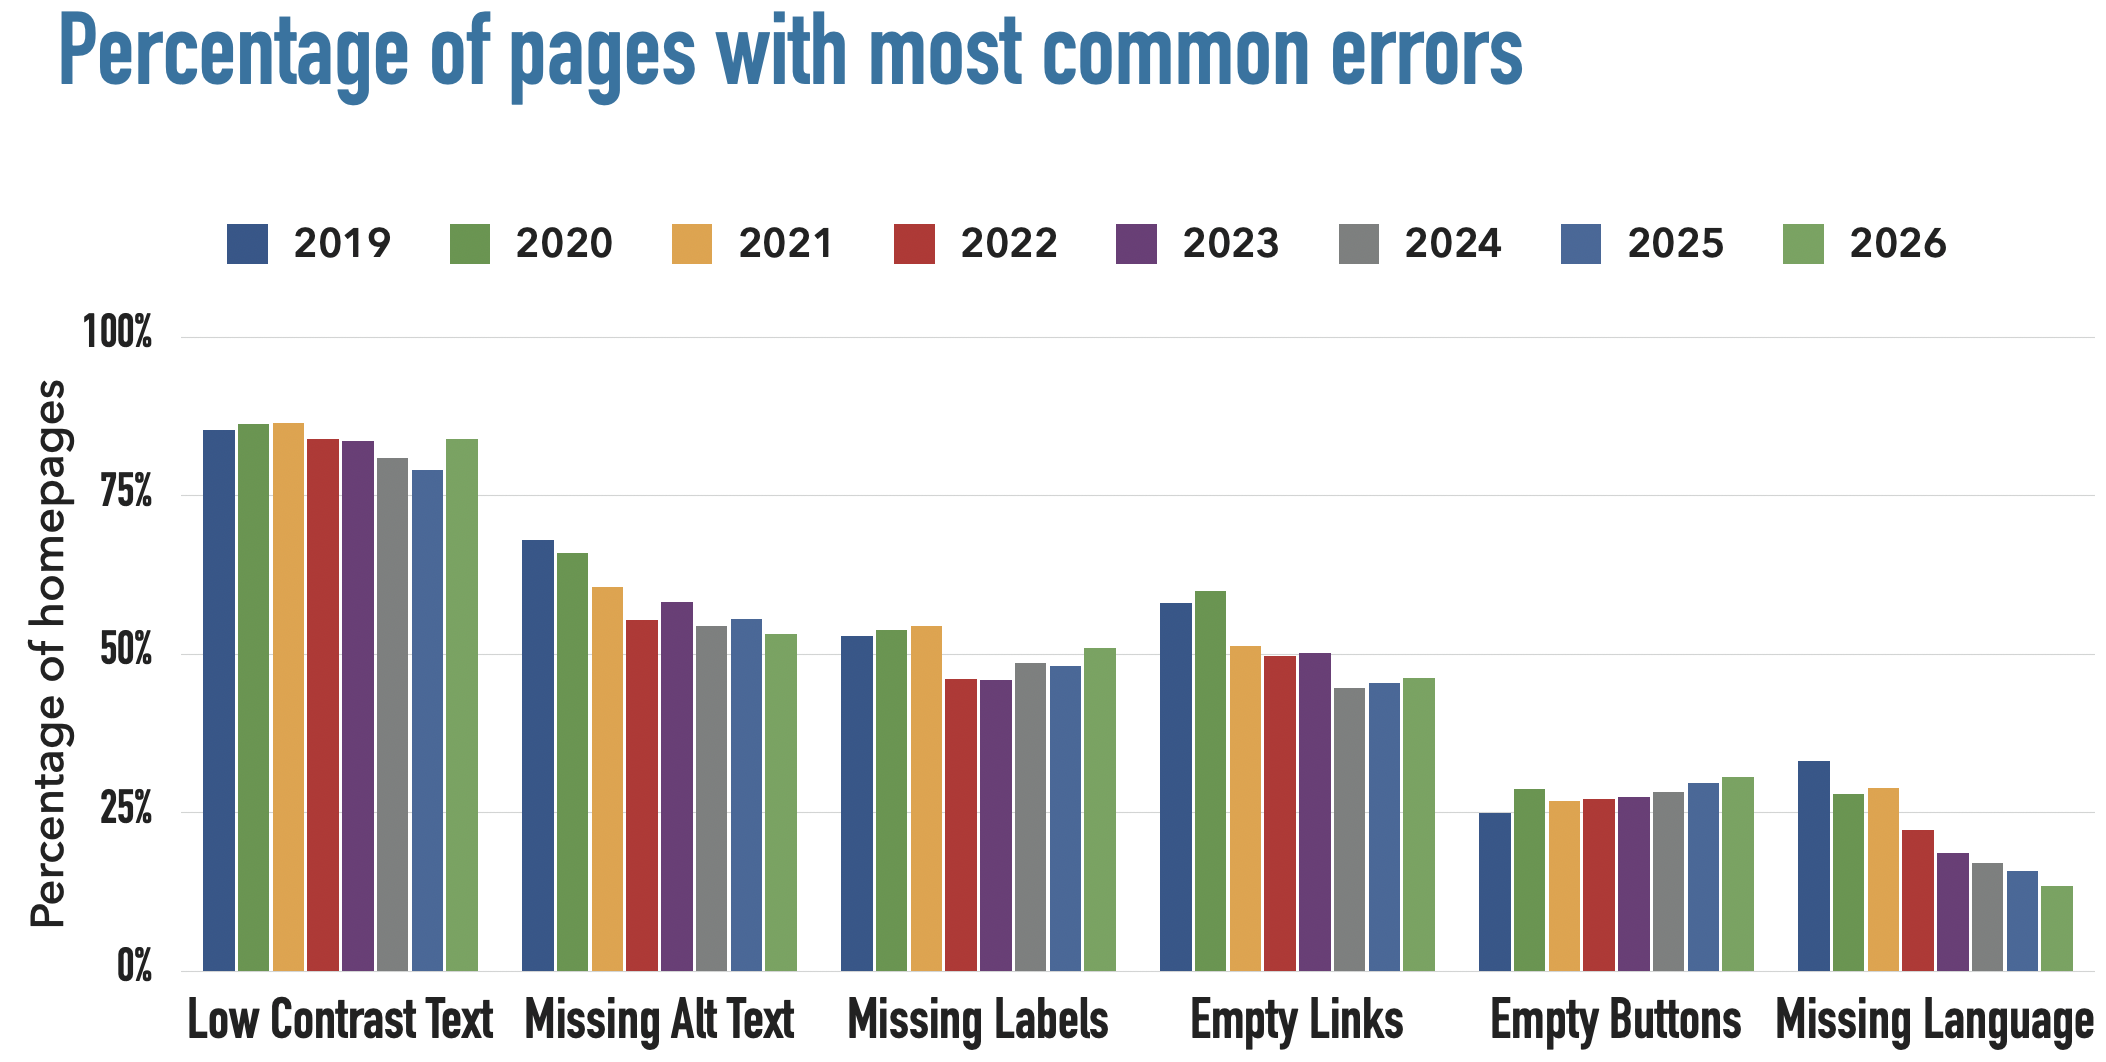
| Issue | 2019 | 2020 | 2021 | 2022 | 2023 | 2024 | 2025 | 2026 |
|---|---|---|---|---|---|---|---|---|
| Low Contrast Text | 85.3% | 86.3% | 86.4% | 83.9% | 83.6% | 81% | 79.1% | 83.9% |
| Missing alt text | 68% | 66% | 60.6% | 55.4% | 58.2% | 54.5% | 55.5% | 53.1% |
| Missing labels | 52.8% | 53.8% | 54.4% | 46.1% | 45.9% | 48.6% | 48.2% | 51% |
| Empty Links | 58.1% | 59.9% | 51.3% | 49.7% | 50.1% | 44.6% | 45.4% | 46.3% |
| Empty buttons | 25% | 28.7% | 26.9% | 27.2% | 27.5% | 28.2% | 29.6% | 30.6% |
| Missing language | 33.1% | 28% | 28.9% | 22.3% | 18.6% | 17.1% | 15.8% | 13.5% |
The number of pages with missing alternative text and missing document language decreased since 2025, whereas pages with low contrast text, missing labels, empty links, and empty buttons increased.
Low Contrast Text
Low contrast text, below the WCAG 2 AA thresholds, was found on 83.9% of home pages, an increase from 79.1% in 2025. This was the most commonly-detected accessibility issue. On average, each home page had 34 distinct instances of low-contrast text, up 15% from 2025.
Images and Alternative Text
Home pages are becoming increasingly graphical with the number of home page images nearly doubling in 8 years. There were over 66.6 million images in the sample, or 66.6 images per home page on average, a surprising 13.6% increase in only one year. 16.2% of all home page images (10.8 per page on average) had missing alternative text (not counting alt=""). While there were notably more images, the proportion of images missing alt text dropped from 18.5% in 2025. 45% of the images missing alternative text were linked images—resulting in links that were not descriptive. One out of every four linked images was missing alternative text.
10.8% of images with alternative text had questionable or repetitive alternative text—such as alt="image", "graphic", "blank", a file name, etc., or alternative text identical to adjacent text or the alternative text of an adjacent image.
These data show that more than one in four images on popular home pages have missing, questionable, or repetitive alternative text. The proportion of problematic images, however, is steadily decreasing over time.
Form Labeling
Home pages had 6.9 form inputs on average—a 36% increase in the last 3 years. One third (33.1%) of those form inputs were not properly labeled (either via <label>, aria-label, aria-labelledby, or title).
Headings
Nearly 30 million headings were detected (29.9 on average per home page). Headings were increasingly prevalent on home pages—the total number of headings increased 20.4% in just one year. The number (and prevalence) of heading levels were:
- 1.5 million
<h1>headings (5.1%) - 8.7 million
<h2>headings (29%) - 11.2 million
<h3>headings (37.5%) - 4.4 million
<h4>headings (14.7%) - 2 million
<h5>headings (6.8%) - 2.1 million
<h6>headings (6.9%)
The number of <h1>s per page has decreased slightly over time. The number of <h4>s and <h5>s increased slightly over time. And the number of <h2>s, <h3>s, and <h6>s increased significantly over time.
The number of <h6>s more than doubled in the last year. Interestingly, 94.9% of home pages that have at least one <h6> also have skipped heading levels. This suggests that most of these headings probably do not reflect the actual document structure.
Because headings are the primary mechanism used by screen reader users to navigate content, their proper implementation is important. 18.1% of home pages had more than one <h1>—an increase from 16.3% in 2025. There were 1,206,444 instances of skipped heading levels (e.g., jumping from <h2> to <h4>)—one in every 25 headings. Skipped heading levels were present on 41.8% of all pages, up from 39% in 2025. 7.5% of pages had no headings, down from 9.8% in 2025.
Regions
Regions/landmarks were increasingly present. 84.3% of home pages had at least one region (or ARIA landmark) defined—an increase from 80.5% in 2025. A <main> element or main landmark was present on 46.1% of home pages, up from 42.6% in 2025. 18.8% of home pages had a "search" landmark, up from 16.6% in 2025.
ARIA
133,589,803 ARIA attributes were detected—over 133 per page on average! ARIA code increased 27% in just one year and is over 6 times higher than it was in 2019.
This chart shows the number of ARIA attributes per home page over time:
The prevalence of ARIA labels and descriptions increased 28% in just the last year. Home pages averaged 31.4 aria-label, aria-labelledby, or aria-describedby attributes.
82.7% of the one million home pages used ARIA (excluding ARIA landmark roles), up from 79.4% in 2025. Home pages with ARIA present had significantly more errors (59.1 on average) than pages without ARIA (42 on average). While ARIA is intended to improve accessibility, one would expect to encounter an additional 17 potential barriers on home pages with ARIA present.
Increased ARIA usage on pages was associated with higher detected errors. The more ARIA attributes that were present, the more detected accessibility errors could be expected. This does not necessarily mean that ARIA introduced these errors (these pages were also more complex), but pages typically had significantly more errors when more ARIA was present.
5.7% of home pages had an ARIA menu (role="menu"), but 22% of those ARIA menus introduced accessibility barriers due to the lack of necessary ARIA menu markup and interactions.
Home pages averaged 23.3 aria-hidden="true" attributes (up 30% from 18 in 2025 and over 250% since 2020) and 4.8 role="button" attributes (up from 3.6 in 2025). Home pages averaged 30.4 instances of tabindex=0 or tabindex=-1 (up 17% from 26 in 2025 and up nearly 300% since 2020).
Links
15.2% of pages had ambiguous link text, such as "click here", "more", "continue", etc. (an increase from 13.7% of pages in 2025, though down from 23.2% in 2020). These pages had 5.3 instances of ambiguous links on average (down from 6.8 in 2025).
Skip Links
17.1% of home pages had a "skip" link present, up from 15.3% in 2025. One out of every ten "skip" links were broken—either they were hidden in a way that made them inaccessible or the link target was not present in the page.
Doctypes
93.2% of home pages had a valid HTML5 doctype—an increase from 92.4% in 2025, 91.6% in 2024, 89.8% in 2023, 86.1% in 2022 and 79.1% in 2021. Pages with a valid HTML5 doctype had nearly double the number of page elements (average of 1497 vs. 754). They also had more detectable errors (average of 56.4 vs. 51.7) than pages with other doctypes. 468 unique doctypes were encountered in the million-page sample.
Site Categories
Site category data was collected using Amazon Web Services Bedrock AI.
The tables below show the average number of pages and detectable errors in each category, and the percent difference in errors for that category from the average of 56.1 errors for the entire million-page sample—ordered from "best" to "worst". In other words, the percentage difference is how much better or worse home pages in that category were than the average home page.
| Category | # of home pages | Avg. # of errors | % difference |
|---|---|---|---|
| Government | 22,345 | 42.4 | −24.4% |
| Non-Profit/Charity | 52,884 | 43.0 | −23.3% |
| Science | 4,420 | 45.0 | −19.8% |
| Personal Finance | 33,383 | 45.4 | −19.0% |
| Careers | 7,903 | 46.2 | −17.7% |
| Law/Government/Politics | 10,829 | 46.6 | −17.0% |
| Social Media | 10,110 | 48.8 | −13.0% |
| Education | 41,711 | 48.9 | −12.8% |
| Technology & Computing | 300,245 | 49.0 | −12.6% |
| Business | 107,509 | 52.6 | −6.3% |
| Gambling/Casinos | 36,977 | 54.1 | −3.5% |
| Health & Fitness | 26,648 | 54.4 | −3.1% |
| Family & Parenting | 5,856 | 56.7 | +1.1% |
| Gaming | 41,237 | 56.9 | +1.3% |
| Food & Drink | 21,921 | 57.4 | +2.3% |
| Religion & Spirituality | 6,217 | 57.5 | +2.4% |
| Society | 4,721 | 59.0 | +5.1% |
| News/Weather/Information | 79,157 | 59.2 | +5.5% |
| Arts & Entertainment | 64,224 | 60.4 | +7.7% |
| Automotive | 24,422 | 60.6 | +8.0% |
| Pets | 5,161 | 61.1 | +8.8% |
| Adult Content | 29,843 | 61.8 | +10.2% |
| Travel | 128,711 | 61.9 | +10.4% |
| Real Estate | 33,059 | 63.3 | +12.9% |
| Hobbies & Interests | 38,063 | 63.6 | +13.4% |
| Home & Garden | 11,141 | 65.9 | +17.4% |
| Style and Fashion | 21,184 | 66.7 | +18.9% |
| Shopping | 95,039 | 71.0 | +26.6% |
| Sports | 15,640 | 71.4 | +27.3% |
There were notable differences in accessibility errors for sites in different categories.
TLDs
1,016 unique top-level domains (e.g., com, .tv, .fashion, etc.) were represented in the million pages analyzed. The table below shows select TLDs with home page counts, average number of errors per home page, and percentage difference from the average of 56.1 errors for the entire million-page sample.
| TLD | # of home pages | Avg. # of errors | % difference |
|---|---|---|---|
| gov | 1,987 | 18.5 | −67.1% |
| edu | 3,174 | 23.0 | −59.0% |
| us | 7,425 | 30.5 | −45.6% |
| xyz | 6,171 | 31.9 | −43.2% |
| io | 9,640 | 34.9 | −37.8% |
| ca | 8,903 | 36.0 | −35.9% |
| uk | 25,325 | 40.9 | −27.1% |
| org | 47,867 | 44.2 | −21.1% |
| nl | 12,660 | 45.5 | −18.9% |
| de | 28,401 | 46.3 | −17.5% |
| co | 7,319 | 49.8 | −11.3% |
| fr | 11,335 | 53.3 | −5.1% |
| net | 40,184 | 53.3 | −5.0% |
| com | 444,978 | 56.2 | +0.2% |
| au | 8,925 | 56.6 | +0.9% |
| eu | 5,128 | 57.0 | +1.5% |
| es | 6,401 | 57.0 | +1.6% |
| jp | 16,376 | 57.3 | +2.1% |
| in | 12,655 | 58.3 | +3.9% |
| it | 11,314 | 59.5 | +6.0% |
| br | 18,792 | 62.5 | +11.4% |
| pl | 10,203 | 67.1 | +19.5% |
| cz | 5,700 | 73.2 | +30.5% |
| ru | 37,039 | 75.4 | +34.4% |
| vn | 4,845 | 78.6 | +40.0% |
| cn | 4,964 | 82.6 | +47.2% |
| ua | 5,316 | 103.1 | +83.7% |
This shows notable differences between TLDs.
Languages
87.3% of pages had a document language defined. This table shows the number of pages, average number of errors, and percentage difference in errors from the overall average of 56.1 for the most common page languages (n>5000).
| Language | # of home pages | Avg. # of errors | % difference |
|---|---|---|---|
| English | 521,826 | 46.0 | −18.0% |
| Dutch | 13,292 | 46.5 | −17.1% |
| German | 36,134 | 46.9 | −16.4% |
| French | 25,036 | 58.5 | +4.2% |
| No language specified | 127,455 | 60.3 | +7.5% |
| Portuguese | 26,278 | 61.1 | +8.8% |
| Japanese | 23,943 | 62.2 | +10.8% |
| Spanish | 35,228 | 64.3 | +14.7% |
| Italian | 12,615 | 64.4 | +14.8% |
| Turkish | 11,248 | 66.2 | +17.9% |
| Polish | 10,059 | 68.7 | +22.5% |
| Arabic | 5,413 | 69.3 | +23.5% |
| Indonesian | 15,161 | 72.5 | +29.2% |
| Vietnamese | 10,847 | 74.5 | +32.8% |
| Russian | 44,288 | 78.1 | +39.2% |
| Korean | 6,628 | 94.6 | +68.7% |
| Chinese | 17,909 | 136.2 | +142.8% |
As with TLDs, there were significant differences in accessibility of pages across languages.
Technologies
Over 1,200 different types of web technologies were detected on the one million home pages. Common technologies detected are listed below. Note that correspondence of additional errors with a technology cannot always be attributed to that technology.
Content management systems and site builders
| CMS | # of home pages | Avg. # of errors | % difference |
|---|---|---|---|
| Adobe Experience Manager | 6,572 | 29.9 | −46.7% |
| Squarespace | 2,669 | 33.0 | −41.2% |
| Wix | 3,183 | 33.3 | −40.6% |
| Hubspot CMS | 4,237 | 35.1 | −37.4% |
| TYPO3 CMS | 5,371 | 38.5 | −31.3% |
| Drupal | 18,222 | 41.2 | −26.5% |
| Joomla | 3,981 | 45.7 | −18.6% |
| WordPress | 252,302 | 52.8 | −5.8% |
| 1C-Bitrix | 8,769 | 106.5 | +89.8% |
There was a wide diversity in the impact that the CMS choice appeared to have on accessibility with home pages. Most pages that use a common CMS had fewer errors than average.
JavaScript frameworks
| Framework | # of home pages | Avg. # of errors | % difference |
|---|---|---|---|
| Astro | 5,472 | 9.0 | −84.0% |
| Next.js | 23,863 | 40.9 | −27.1% |
| React | 45,673 | 43.5 | −22.5% |
| Nuxt.js | 14,232 | 54.7 | −2.6% |
| Stimulus | 8,474 | 60.4 | +7.7% |
| Vue.js | 55,049 | 64.6 | +15.1% |
| AMP | 23,261 | 65.0 | +15.9% |
| RequireJS | 14,365 | 70.7 | +26.1% |
| AngularJS | 6,054 | 76.6 | +36.4% |
| Firebase | 8,426 | 82.9 | +47.7% |
JavaScript libraries
| Library | # of home pages | Avg. # of errors | % difference |
|---|---|---|---|
| Lodash | 10,586 | 55.3 | −1.5% |
| Modernizr | 64,148 | 57.0 | +1.5% |
| jQuery Migrate | 180,237 | 57.5 | +2.5% |
| jQuery | 560,294 | 64.9 | +15.7% |
| Slider Revolution | 15,871 | 67.2 | +19.8% |
| DataTables | 6,724 | 69.6 | +24.0% |
| Lightbox | 38,846 | 70.5 | +25.7% |
| OWL Carousel | 83,396 | 70.7 | +26.1% |
| Slick | 98,069 | 70.9 | +26.4% |
| Underscore.js | 34,701 | 73.5 | +31.0% |
| Swiper | 52,861 | 74.0 | +31.8% |
| jQuery UI | 53,076 | 79.9 | +42.3% |
| prettyPhoto | 7,810 | 80.4 | +43.3% |
| Moment.js | 23,875 | 80.6 | +43.6% |
| Select2 | 15,211 | 82.0 | +46.2% |
| Clipboard.js | 6,619 | 89.2 | +59.0% |
| FancyBox | 18,011 | 90.0 | +60.3% |
| SweetAlert2 | 10,571 | 101.6 | +81.0% |
The presence of nearly all of these popular JavaScript libraries was associated with an increase in detected accessibility errors.
Web frameworks
| Web Framework | # of home pages | Avg. # of errors | % difference |
|---|---|---|---|
| Next.js | 23,863 | 40.9 | −27.1% |
| Express | 8,121 | 52.0 | −7.3% |
| ZURB foundation | 11,905 | 54.3 | −3.3% |
| UIkit | 6,220 | 57.3 | +2.1% |
| Microsoft ASP | 36,141 | 58.4 | +4.1% |
| Bootstrap | 240,869 | 63.3 | +12.8% |
Ecommerce platforms
| Platform | # of home pages | Avg. # of errors | % difference |
|---|---|---|---|
| Shopify | 42,516 | 75.1 | +33.9% |
| Magento | 7,996 | 75.8 | +35.0% |
| Prestashop | 5,044 | 143.2 | +155.3% |
Advertising networks
| Ad Network | # of home pages | Avg. # of errors | % difference |
|---|---|---|---|
| theTradeDesk | 9,608 | 38.7 | −31.0% |
| LinkedIn Ads | 16,625 | 42.6 | −24.1% |
| Teads | 6,572 | 50.2 | −10.5% |
| Amazon Advertising | 15,496 | 52.0 | −7.4% |
| Twitter Ads | 16,419 | 57.1 | +1.8% |
| Pubmatic | 14,758 | 57.9 | +3.2% |
| Microsoft Advertising | 46,995 | 58.5 | +4.3% |
| Rubicon Project | 15,197 | 59.1 | +5.3% |
| ID5 | 18,670 | 59.3 | +5.7% |
| AppNexus | 8,988 | 60.8 | +8.4% |
| Doubleclick | 21,805 | 62.5 | +11.4% |
| AdSense | 86,497 | 63.2 | +12.6% |
| Taboola | 8,544 | 63.9 | +13.9% |
| Pinterest Ads | 20,205 | 73.7 | +31.3% |
| 33Across | 13,807 | 82.2 | +46.4% |
| Yandex | 44,933 | 86.7 | +54.6% |
Pages that utilized most of these popular ad systems had more errors on average than pages that did not utilize ad networks. The data suggest that ads were among the strongest harbingers of accessibility errors.
Other technologies
Other common technologies also correlated to more errors:
- 9.6% of pages had ReCAPTCHA, and these pages had 7.7 more errors than average.
- 6.2% of pages were detected as having YouTube videos and these pages had 9.4 more errors than average.
Web sites that used common cookie compliance technologies, such as OneTrust (34.6 errors on average), averaged notably fewer errors than average, whereas sites that used browser fingerprinting and user tracking technologies, such as FingerprintJS (112.4 errors on average), had significantly more errors than average. This may suggest a relationship between user privacy and accessibility practices.
948,225 tables were observed on 143,575 pages (down from 972,746 tables on 142,976 pages in 2025). 181,188 (19%) of the tables had valid data table markup.
Conclusion
The 2026 WebAIM Million analysis found notable increases in both the number of detected accessibility errors and number of pages with WCAG conformance failures, reversing a trend of gradual accessibility improvements in recent years. A primary concern is the significant increase in home page complexity and ARIA code—both of which correlate to increased detectable errors.
These trends likely reflect broader shifts in web development including increased reliance on 3rd party frameworks and libraries and automated or AI-assisted coding practices (“vibe coding”). Home pages are getting larger and more technologically complex at an alarming rate, making accessibility more difficult to achieve and maintain. A key takeaway from this year's report is improving accessibility at scale will require both better practices and simpler systems. Alternatively, complex systems need to do a better job of focusing on accessibility fundamentals.